
Products Used
The first step is to provide users with the permission to view the reports and data within CX Analytics. This configuration is performed at the Role level, where all users within a role share the same permissions. Role configuration is performed by navigating to Contact Center Management → Roles in the Zoom admin portal. Note: You must be logged in to the Zoom admin portal as a Contact Center administrator to make changes to roles.
For each role you must define the CX Analytics permissions for users within that role. When configuring a role you will find a new tab labelled CX Analytics in which you will configure view/edit permissions to Reports, Logs and Dashboards, and define the scope of the data which is visible to users within that role.
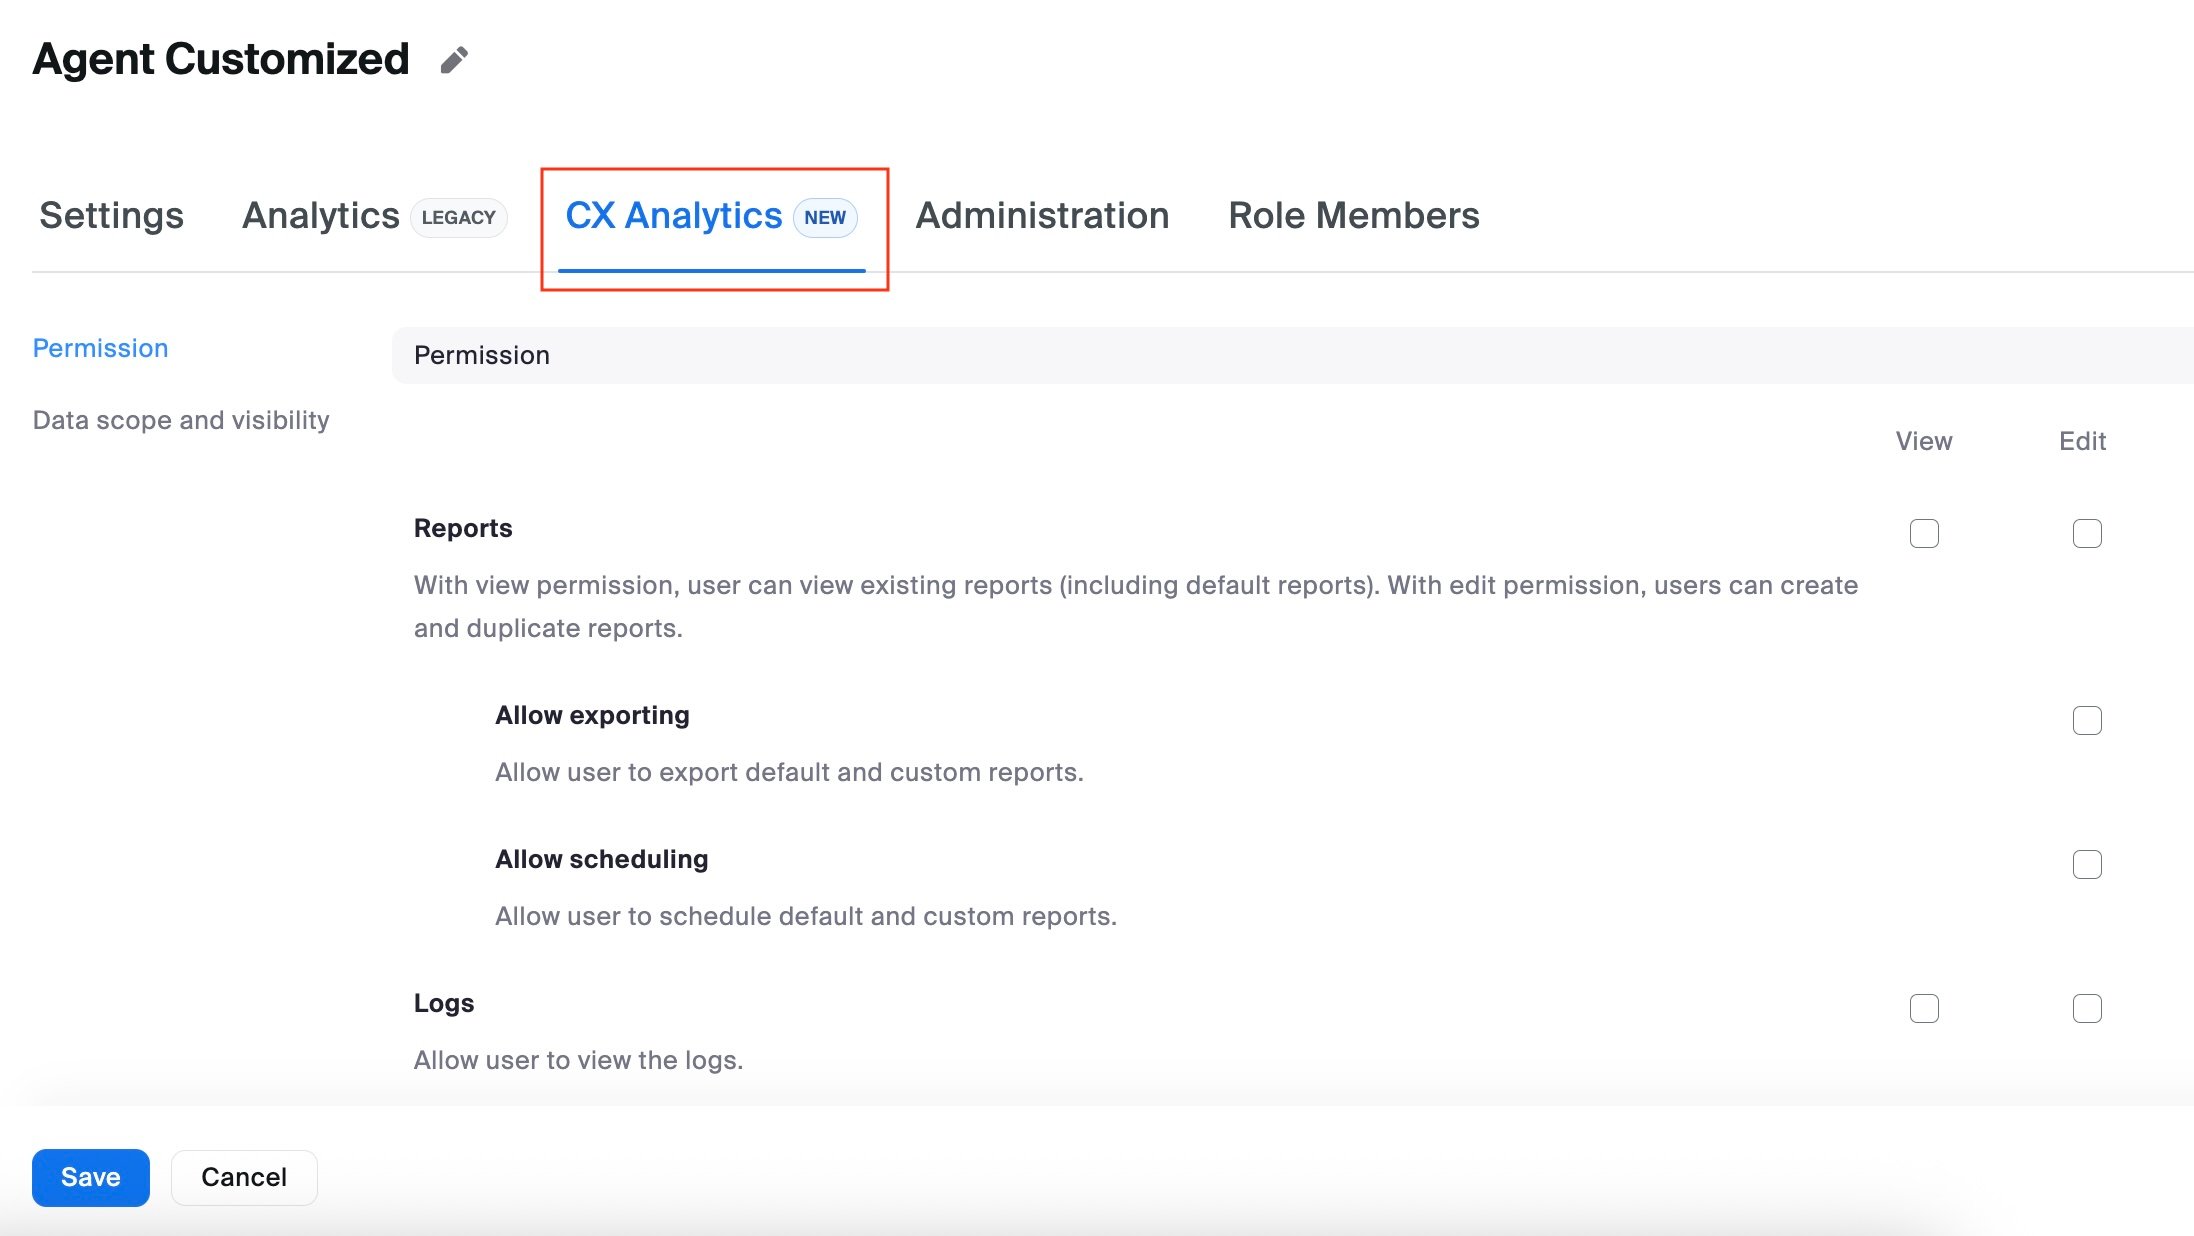
The CX Analytics tab will allow you to configure the following:
-
- View/Edit permission to Historical Reports, Engagement Logs, and Real-time Dashboards
- Data Scope and Visibility for Agents, Queues, Engagements and Flows
There are two types of roles, Default and Custom, which are pre-configured with various default permissions for CX Analytics.
Default Roles
There are three default roles: Admin, Supervisor and Agent.
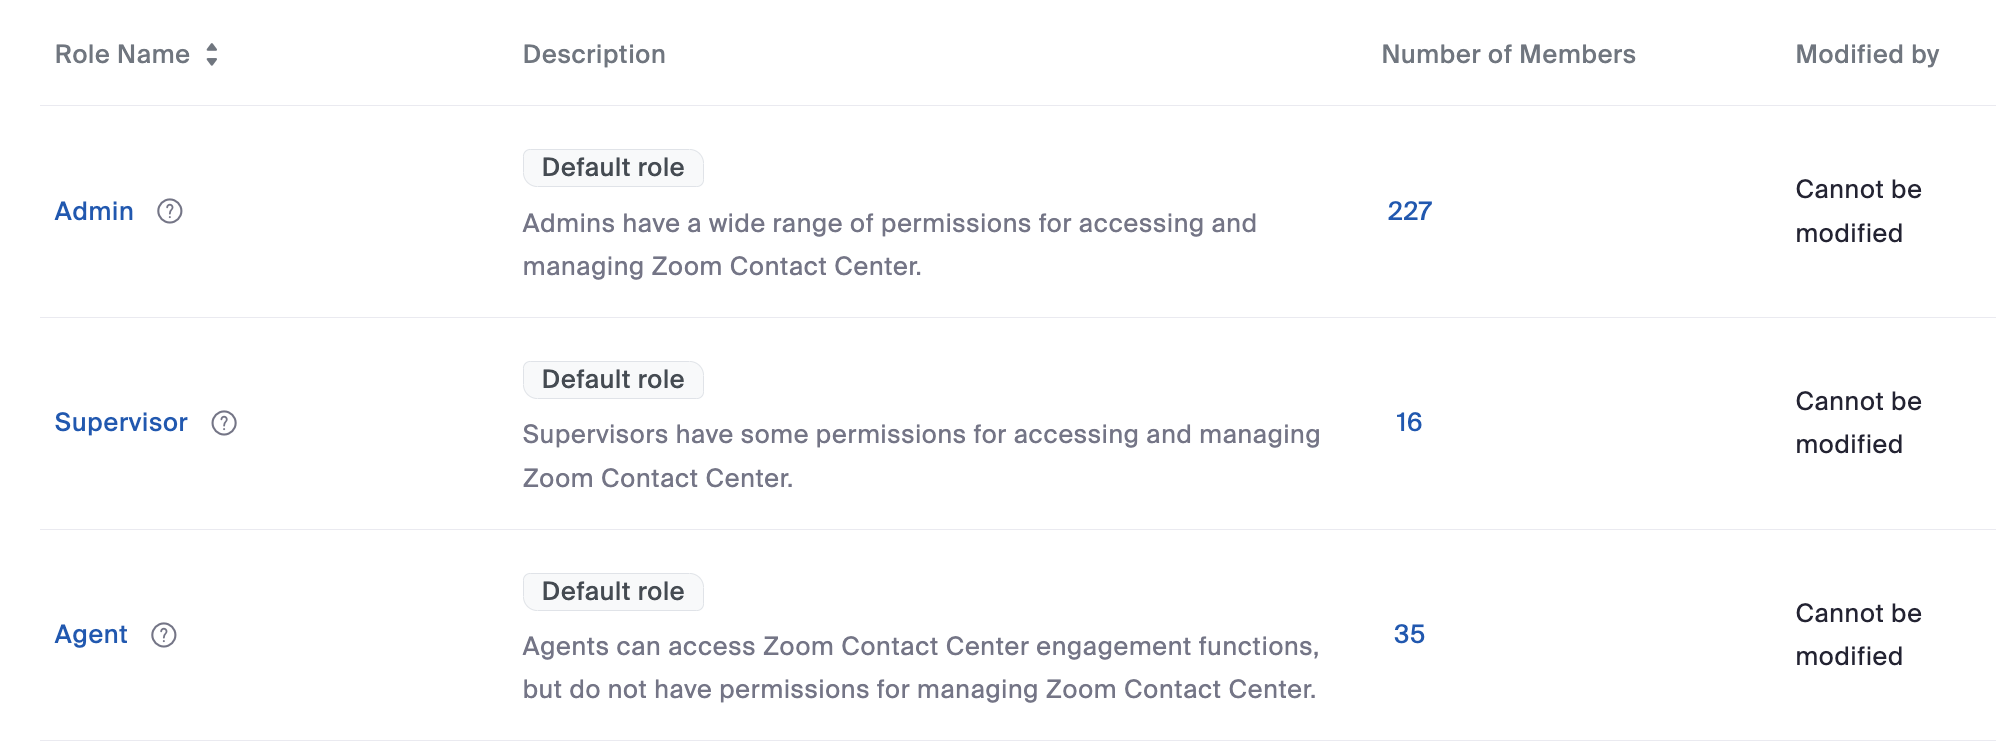
Default roles are pre-configured with CX Analytics permissions that cannot be modified. These are detailed in the following table.
|
Default Role |
CX Analytics Permissions |
|
Admin |
|
|
Supervisor |
|
|
Agent |
|
If you have users assigned to default roles and you would like to modify their permissions you must first create a new role or duplicate the default role. Further information about managing Contact Center roles can be found by visiting this link.
Custom Roles
Custom roles are defined by the administrator and can be created from scratch, or you can create a duplicate of a default role. When duplicating a default role, the new role will inherit the default role's CX Analytics permissions. When creating a new role, CX Analytics permissions are disabled by default and must be enabled by the administrator.
To start using CX Analytics you must identify all roles that require access to reporting and then configure the CX Analytics permissions accordingly. Configure permissions by following the steps defined below.
1. Navigate to Contact Center Management → Roles.
2. Click on the role you wish to modify.
3. Click the CX Analytics tab.
4. Configure View/Edit permissions to Reports, Dashboards and Logs according to the capabilities required by users assigned to that role.
5. Configure the Data Scope and Visibility for Agents, Queues, Engagements and Flows according to the visibility required by users assigned to that role.
6. Scroll to the bottom of the page and click Save.
Repeat the steps above for all roles that require access to CX Analytics.
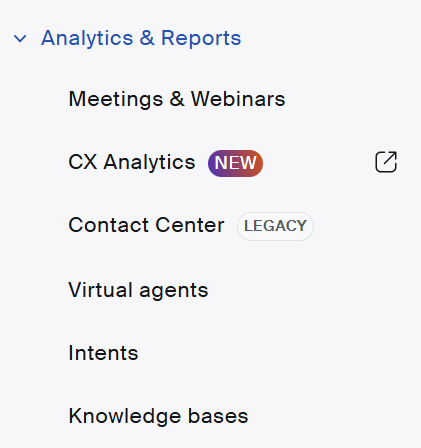
Once you have configured roles with the necessary permissions to access CX Analytics, you can navigate to the CX Analytics landing page by navigating to Analytics & Reports → CX Analytics.
Reporting is now accessed by navigating to Analytics & Reports and selecting CX Analytics from the drop-down menu. Legacy Contact Center reports and the new CX Analytics are both accessed from this menu.
The next steps will guide you through the following process:
- Creating real-time dashboards.
- Using default reports and creating custom reports.
- Creating subscriptions for automatic distribution of historical reports.
Real-Time Dashboards
The CX Analytics Dashboards offer contact center users the ability to monitor the performance of the contact center in real-time using customizable dashboards.
Creating a Dashboard
To get started you will need to create dashboards to cater for your real-time reporting requirements. This section will guide you through the process of creating a simple dashboard that you can build upon.
1. Navigate to Dashboards in the left-hand navigation menu. Here you'll find tabs for:
-
- Default dashboards: Pre-defined dashboard templates that are ready to use.
- My dashboards: Custom dashboards that you've created.
- Shared with me: Dashboards created by others that have been shared with you.
- Starred: Dashboards that you have 'starred' as favorite dashboards.
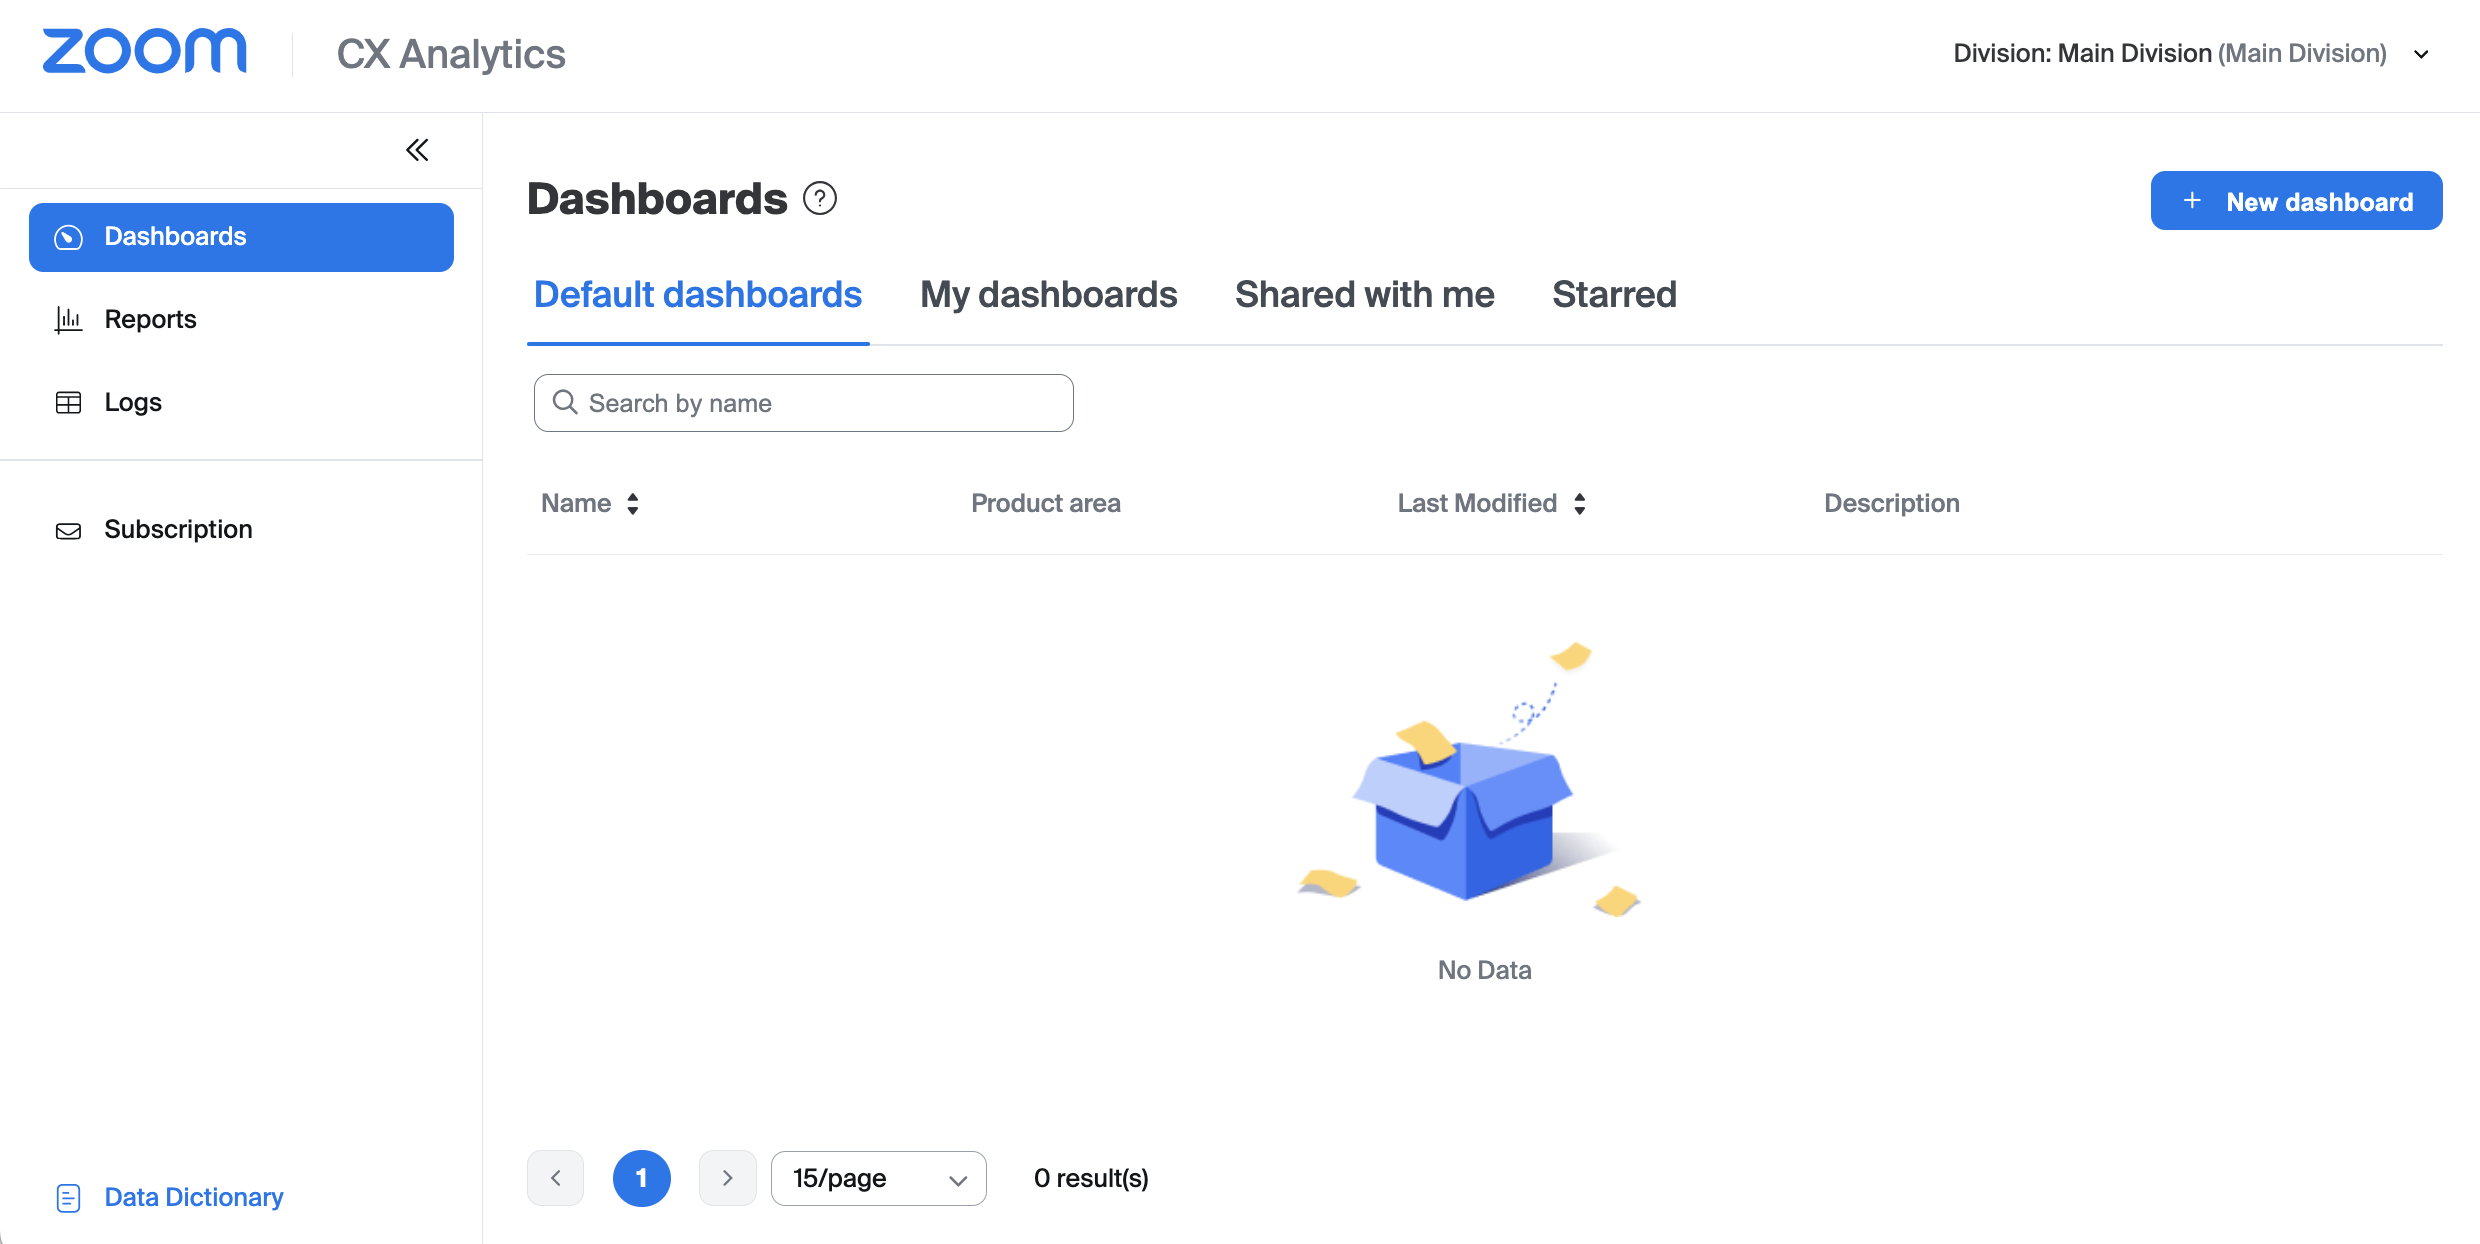
2. Click +New Dashboard.
3. Give your new dashboard and name and optional description, then click Add. You will be presented with the dashboard editor where you'll start with a blank report.
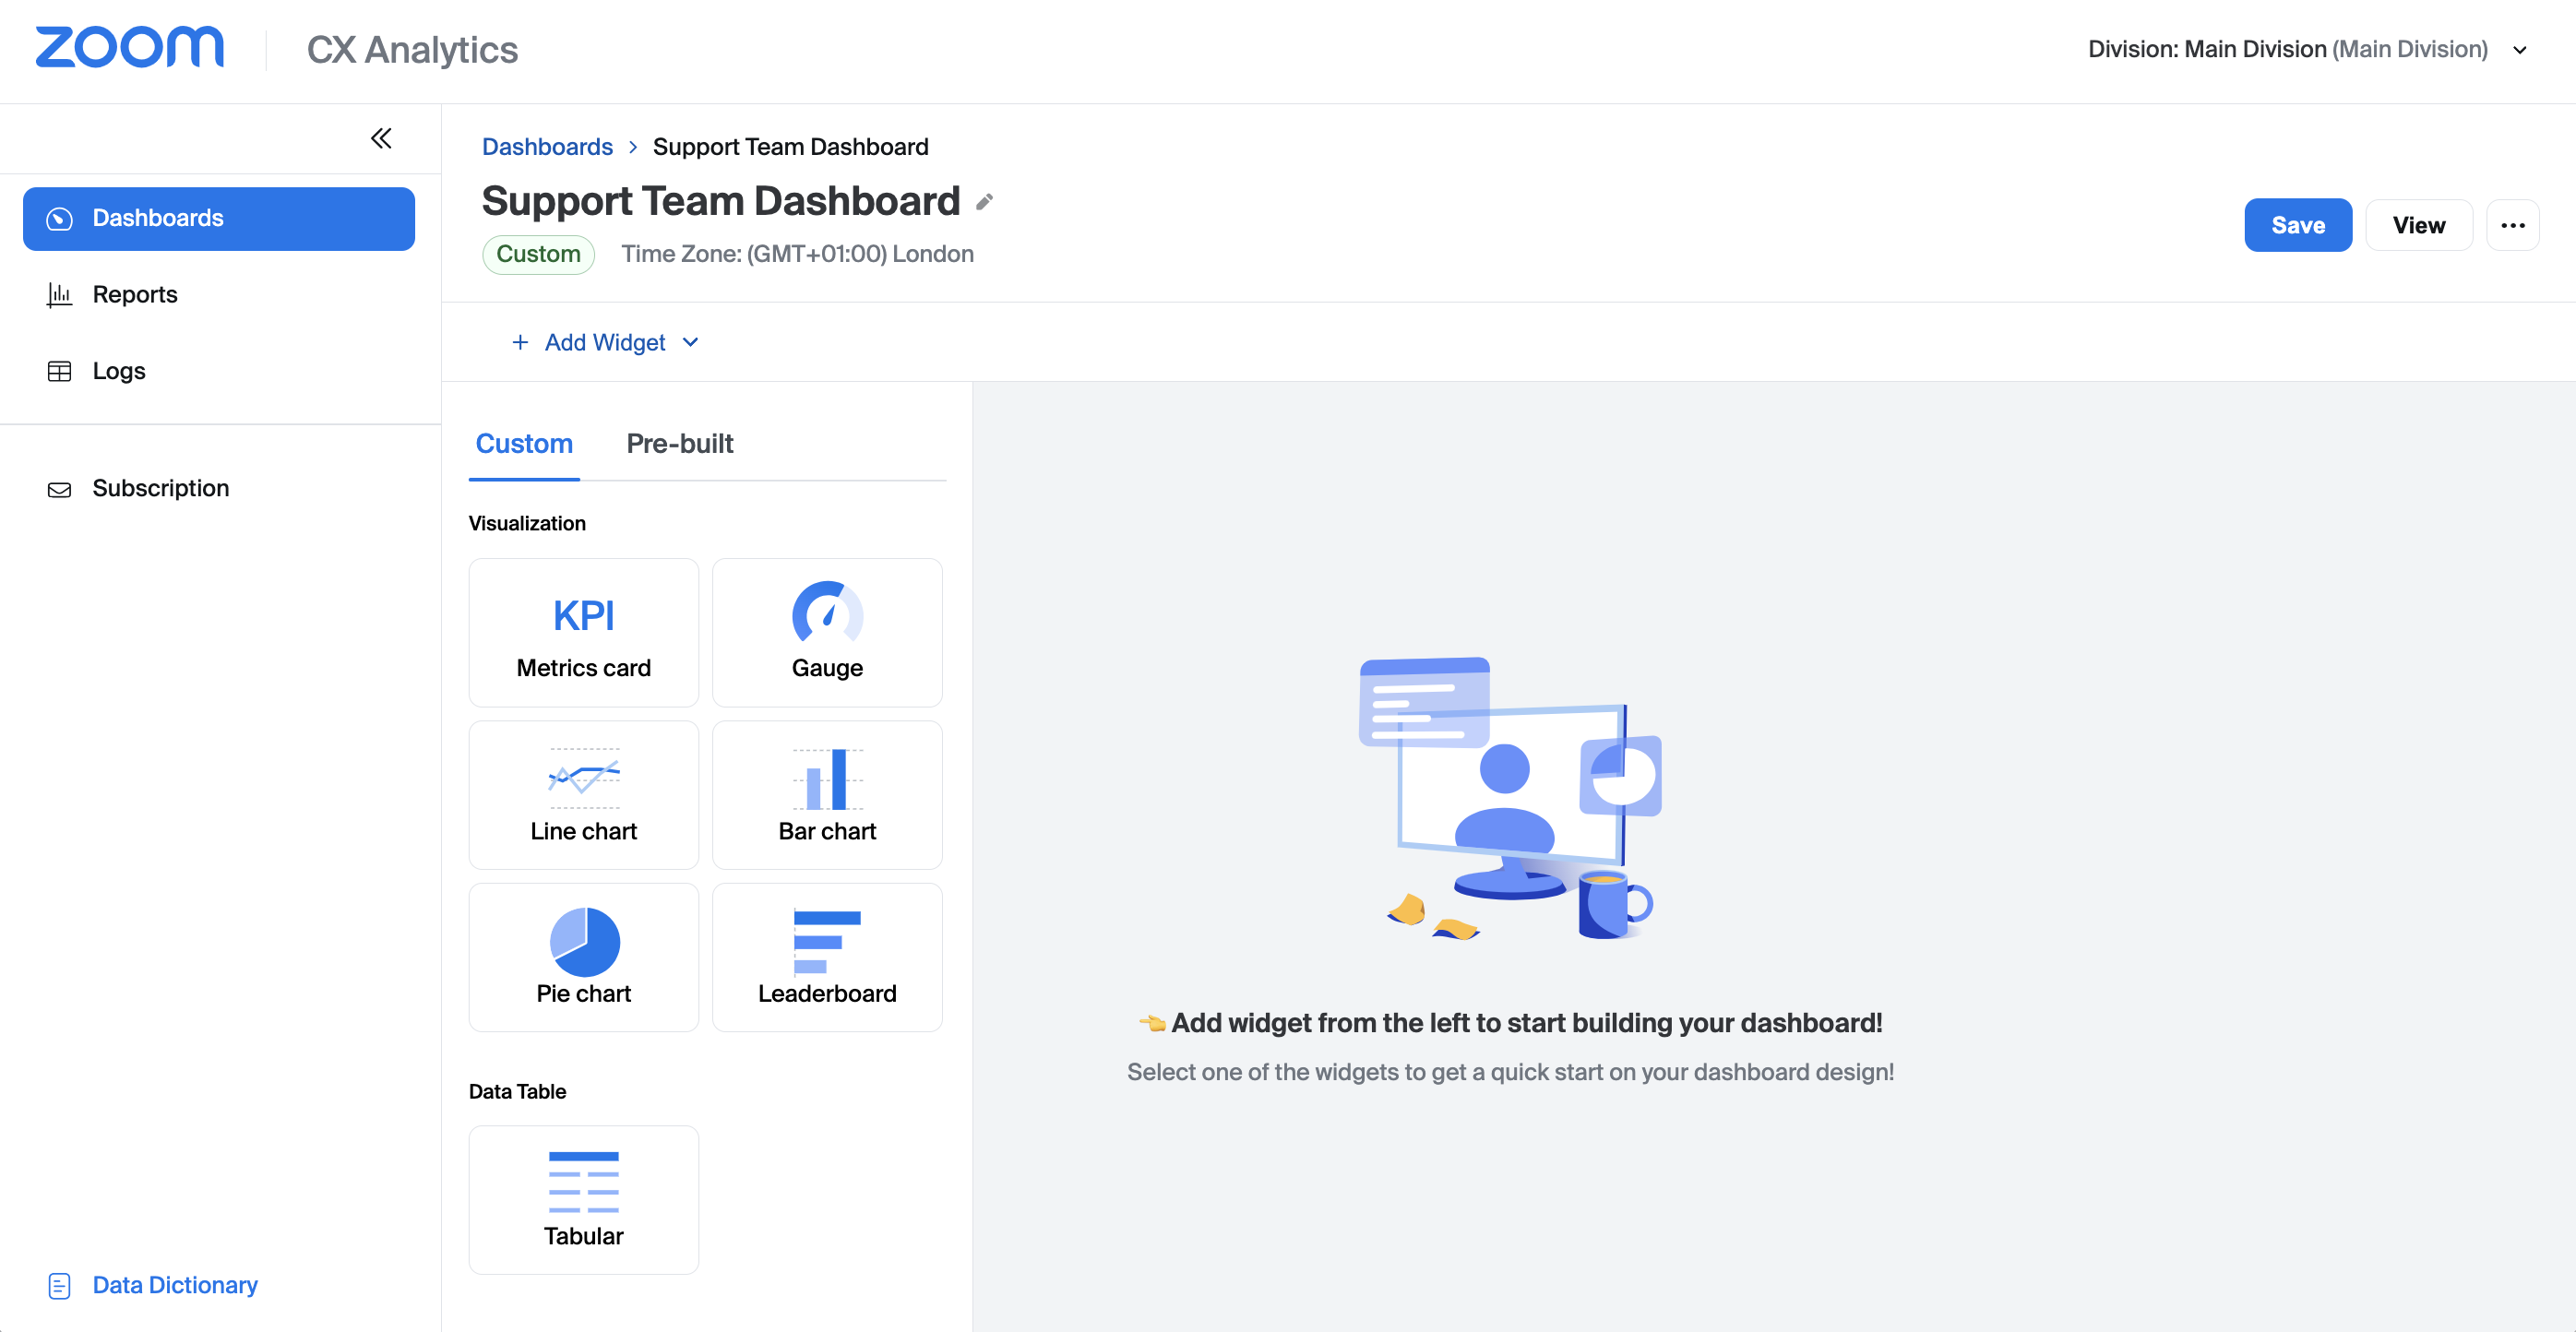
4. Select the Metrics card from the list. You have multiple widgets available in a real-time dashboard:
-
- Metrics card
- Gauge
- Line Chart / Bar Chart / Pie Chart
- Leaderboard
- Tabular data table
5. In the Dataset drop-down select Queue Performance.
6. Scroll down to the Measure section and drag In-queue waiting into the Selected measure section.
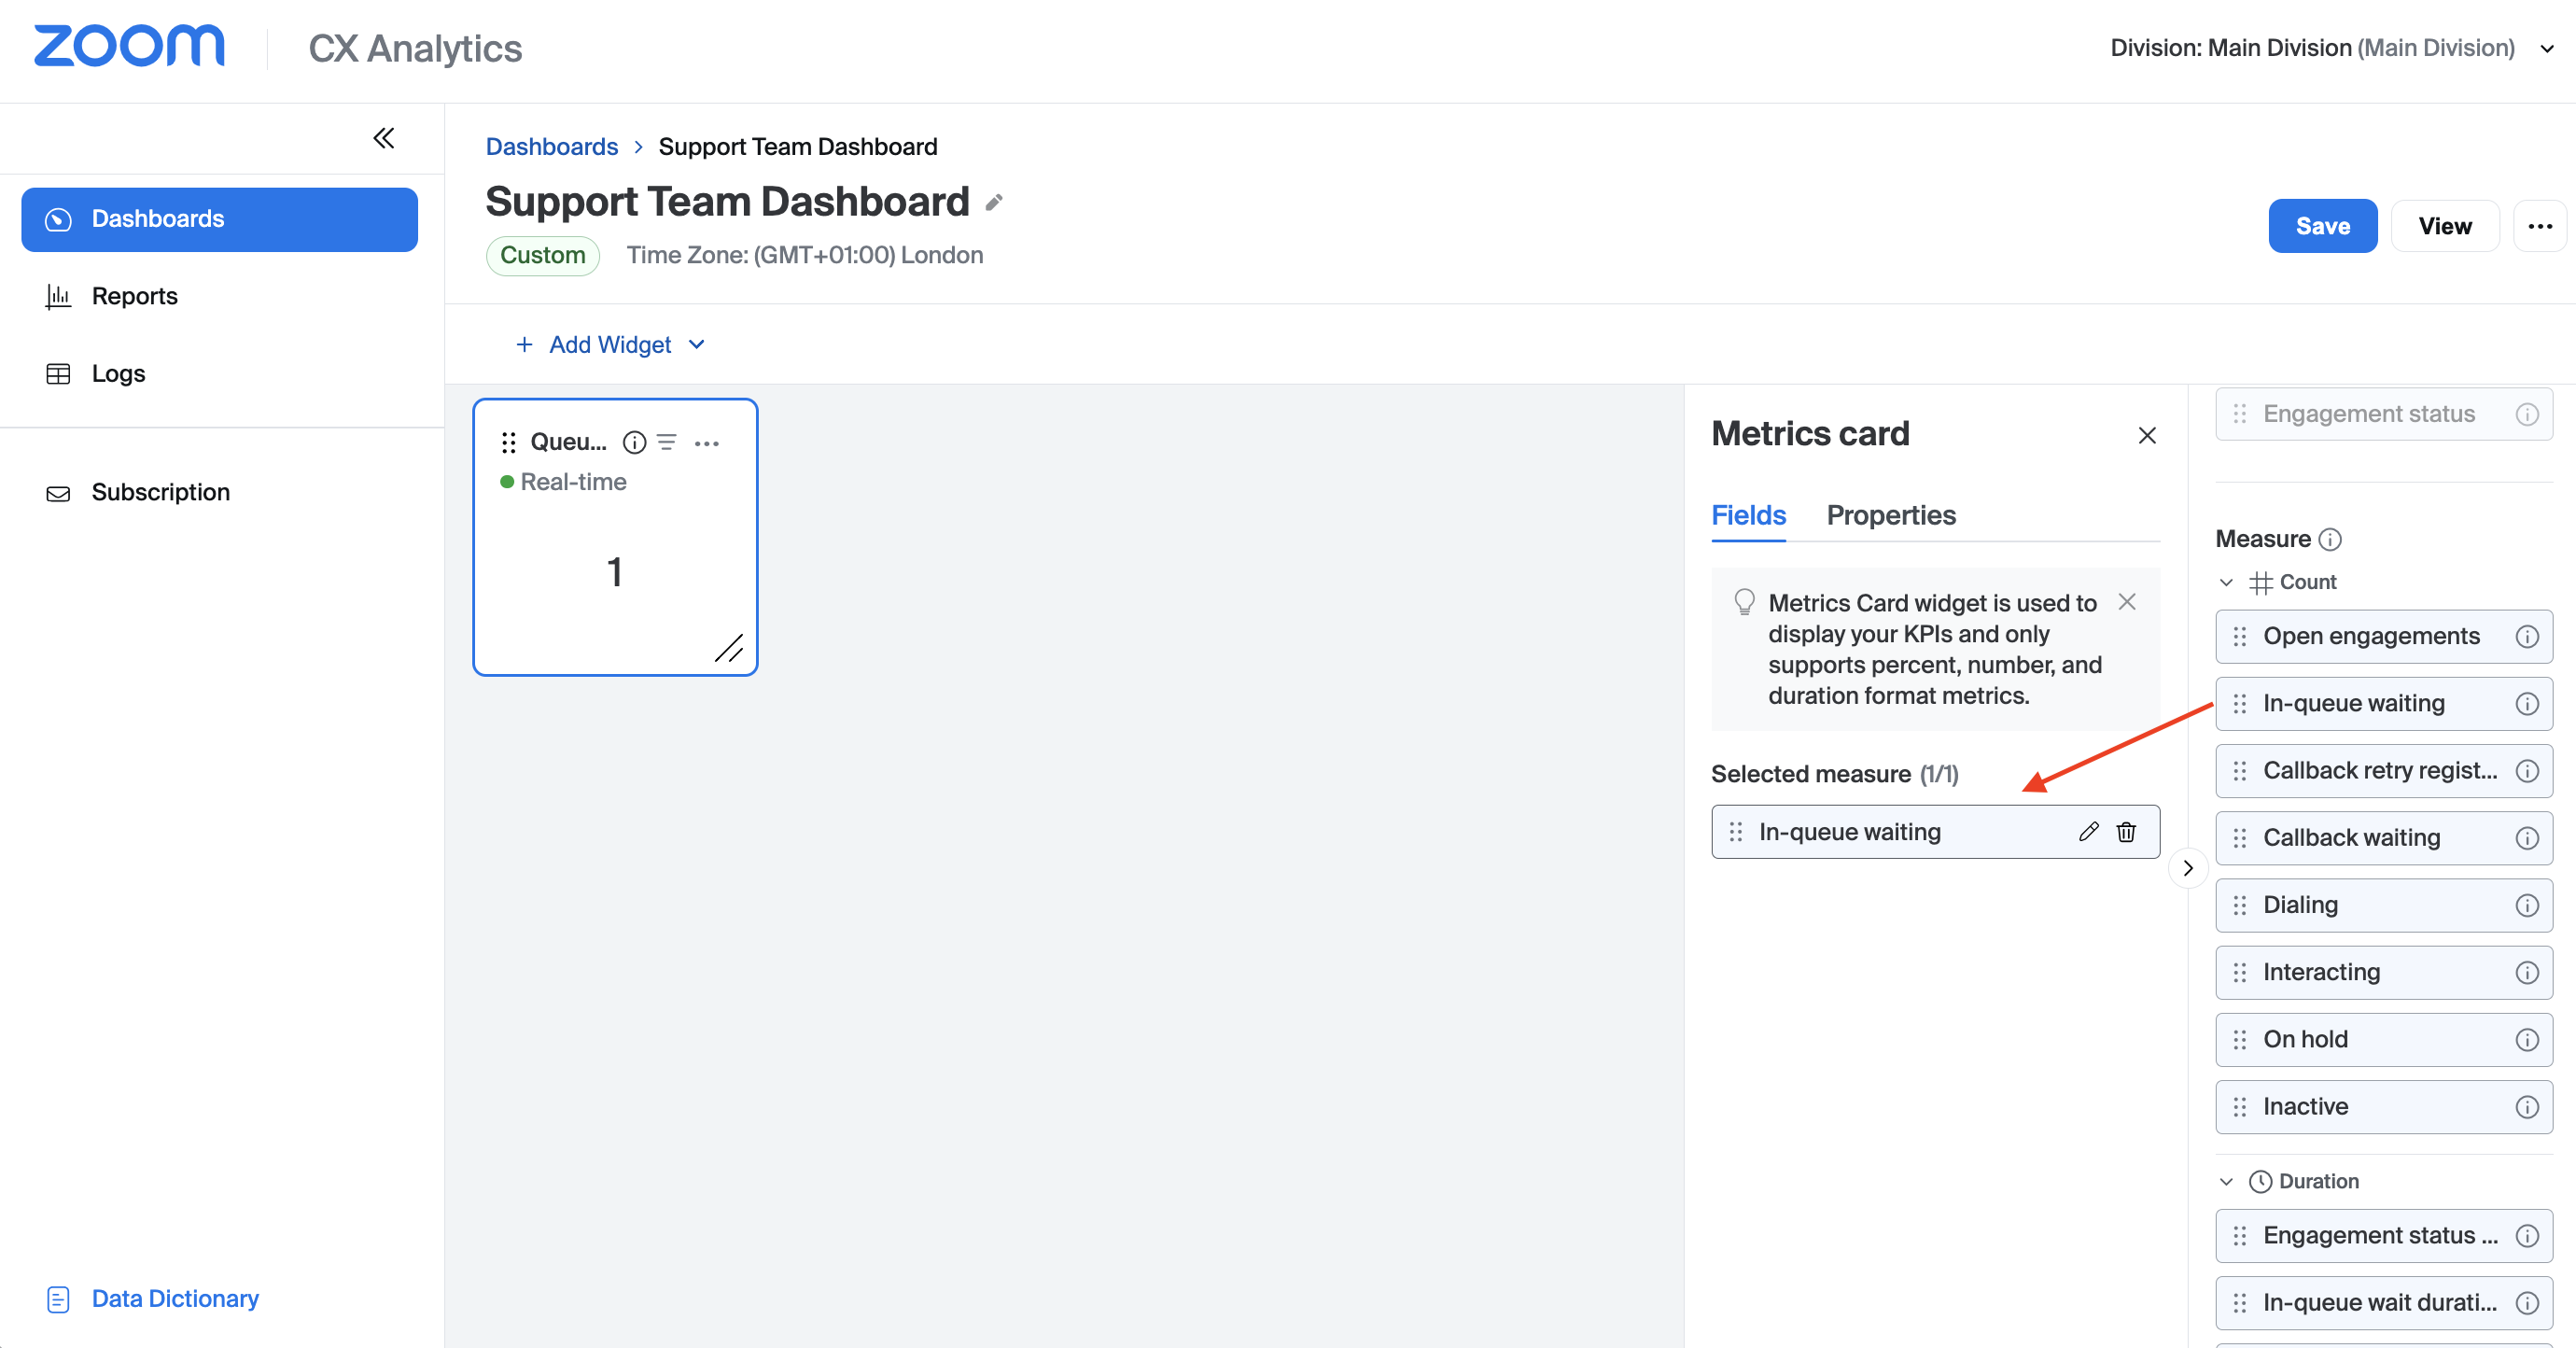
7. Continue to add further widgets to the dashboard by clicking the +Add Widget drop-down and selecting the required widget from the panel. Configure your required measures as before.
8. When you've finished adding widgets to the dashboard, click Save followed by View to view your newly created dashboard.
For more detailed information about creating and managing CX Analytics dashboards please visit our support article which is available at this link.
Sharing a Dashboard
Your custom dashboards can be quickly shared with other users in the Contact Center.
1. Navigate to Dashboards → My dashboards and select one of your dashboards by clicking the title.
2. Click the ellipsis on the top right-hand side and then click Share from the drop-down menu.
3. The Link access section gives you the option to select whether this dashboard is available to collaborators only (the default), or whether it is available to any contact center user.
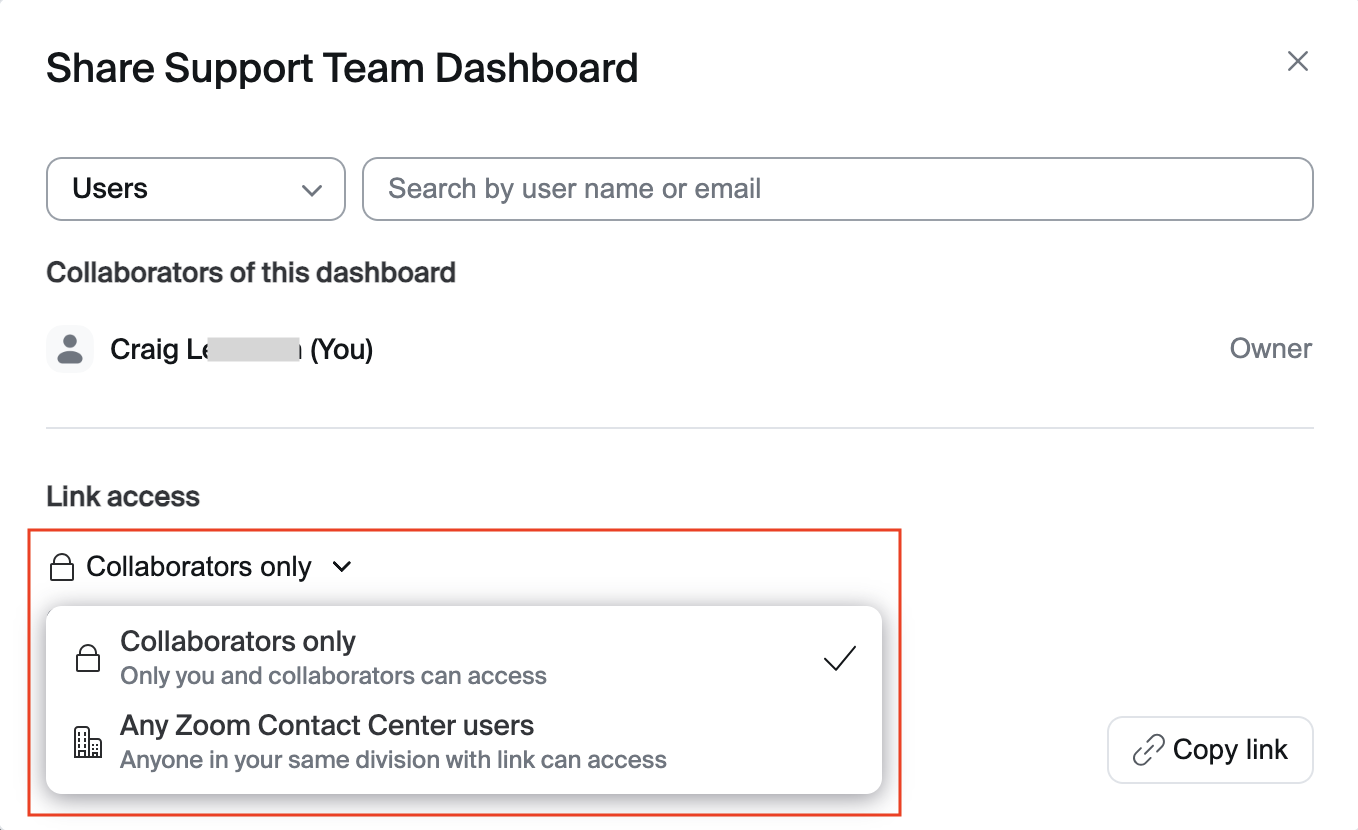
Selecting Any Zoom Contact Center users will make this dashboard viewable by all contact center users via a link (role permissions are still required). Any users who need the ability to edit a dashboard must still be added as collaborators.
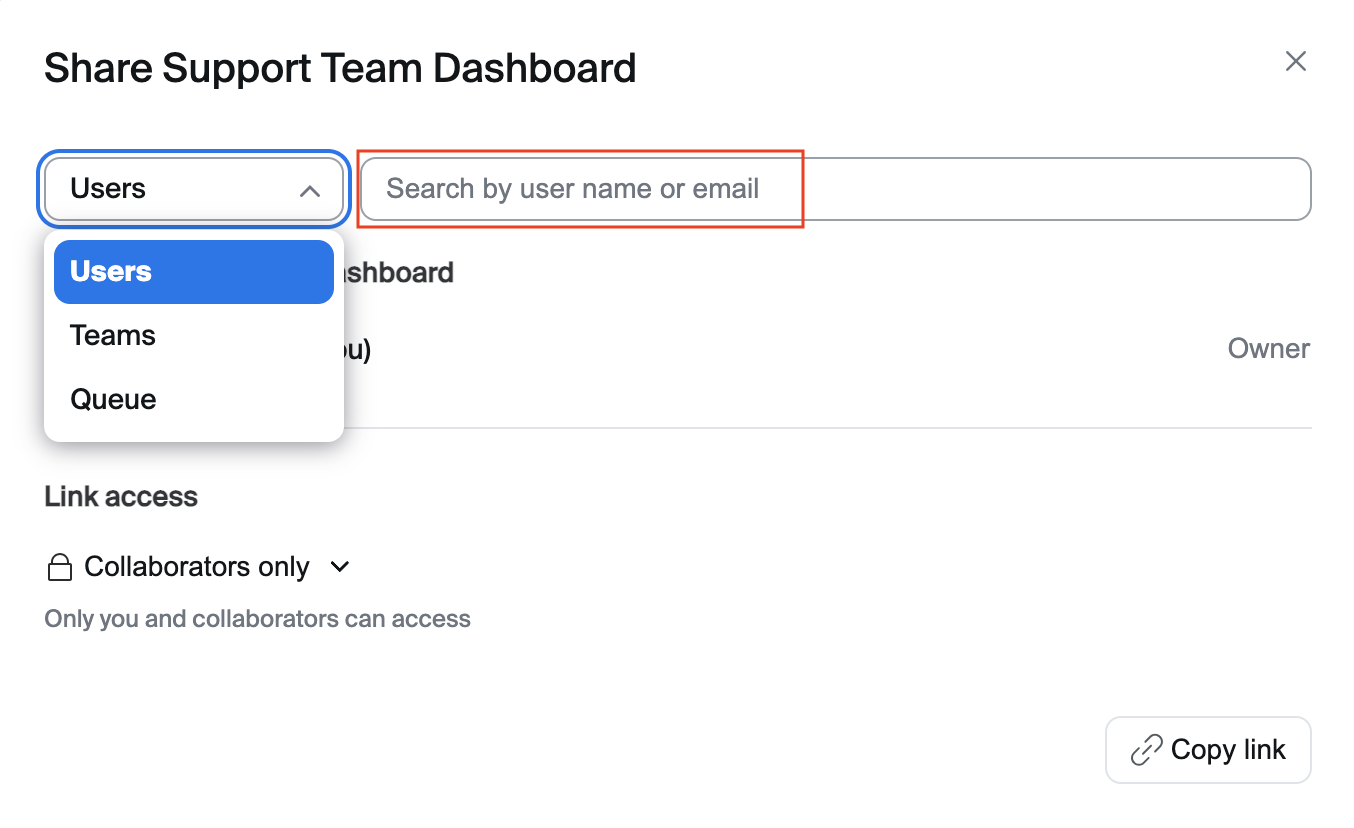
4. Use the drop-down on the top left-hand side to select whether you'd like to add users, teams or queues to the list of collaborators, then use the search field on the right to search for associated contact center entities. Make a selection from your search results.
5. Enter an optional Invite message.
6. On the bottom right-hand side of the window, click the down arrow and select either Add as viewers or Add as editors depending on the required permissions.
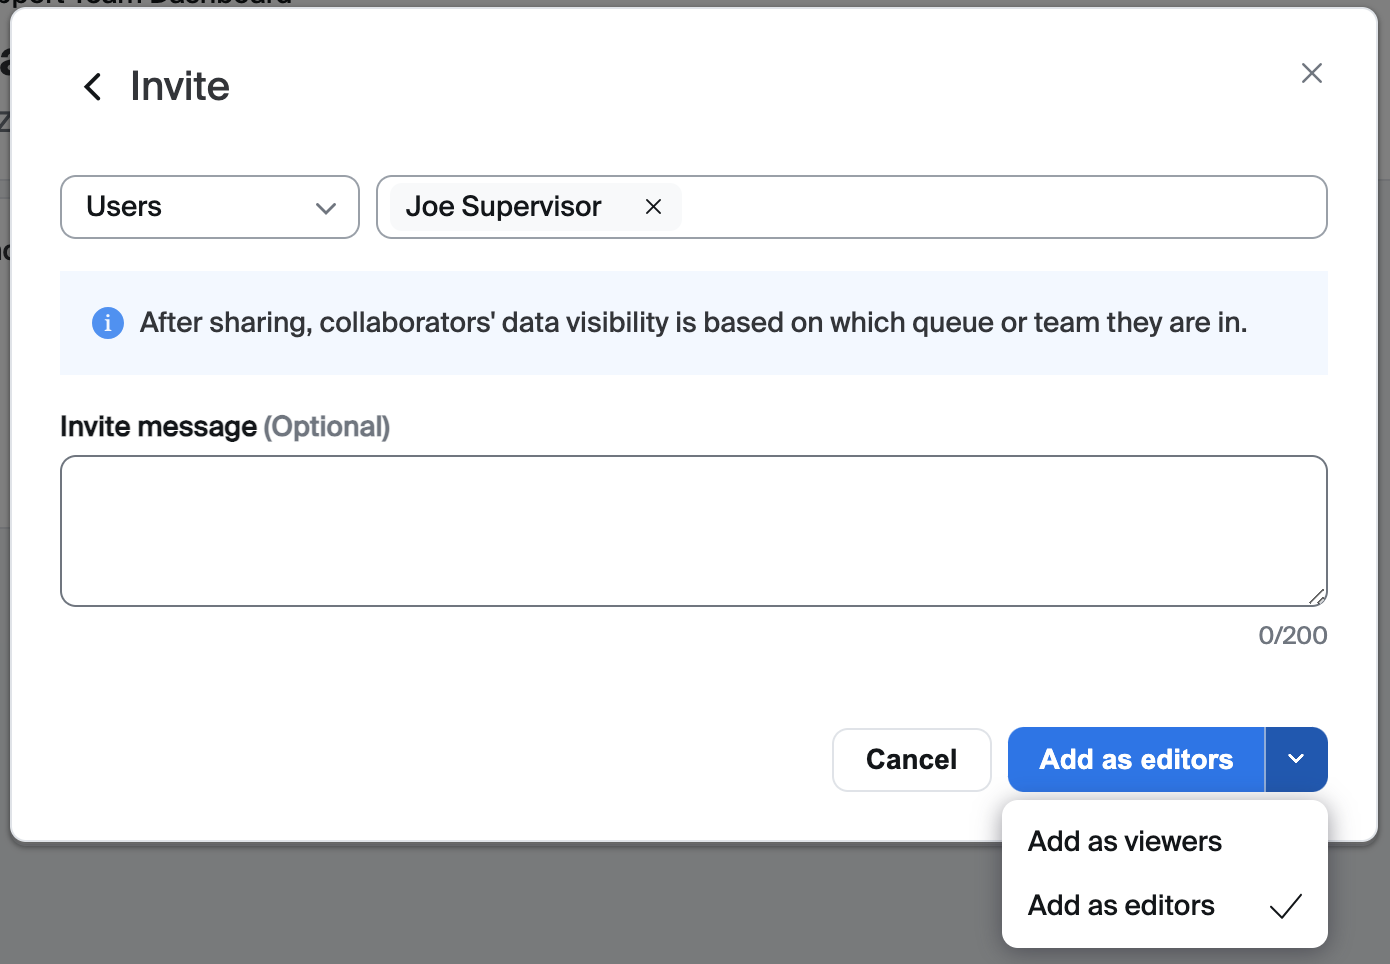
7. Click the blue button to add the editors/viewers.
8. Return to step 4 and repeat the process for any additional collaborators.
Historical Reports
The CX Analytics reports offer a quick and comprehensive overview of contact center performance. Within the Reports page you'll find tabs for:
-
- Default reports: Pre-configured historical reports that are ready to use.
- My reports: Custom historical reports that you've created.
- Starred reports: Historical reports that you have 'starred' as favorite reports.
Viewing Default Reports
Default reports have been designed to closely resemble the legacy Contact Center reports, giving you the ability to view reports as soon as you begin using CX Analytics. We will explore the ability to create custom reports later in this guide.
Start by navigating to Reports → Default report.
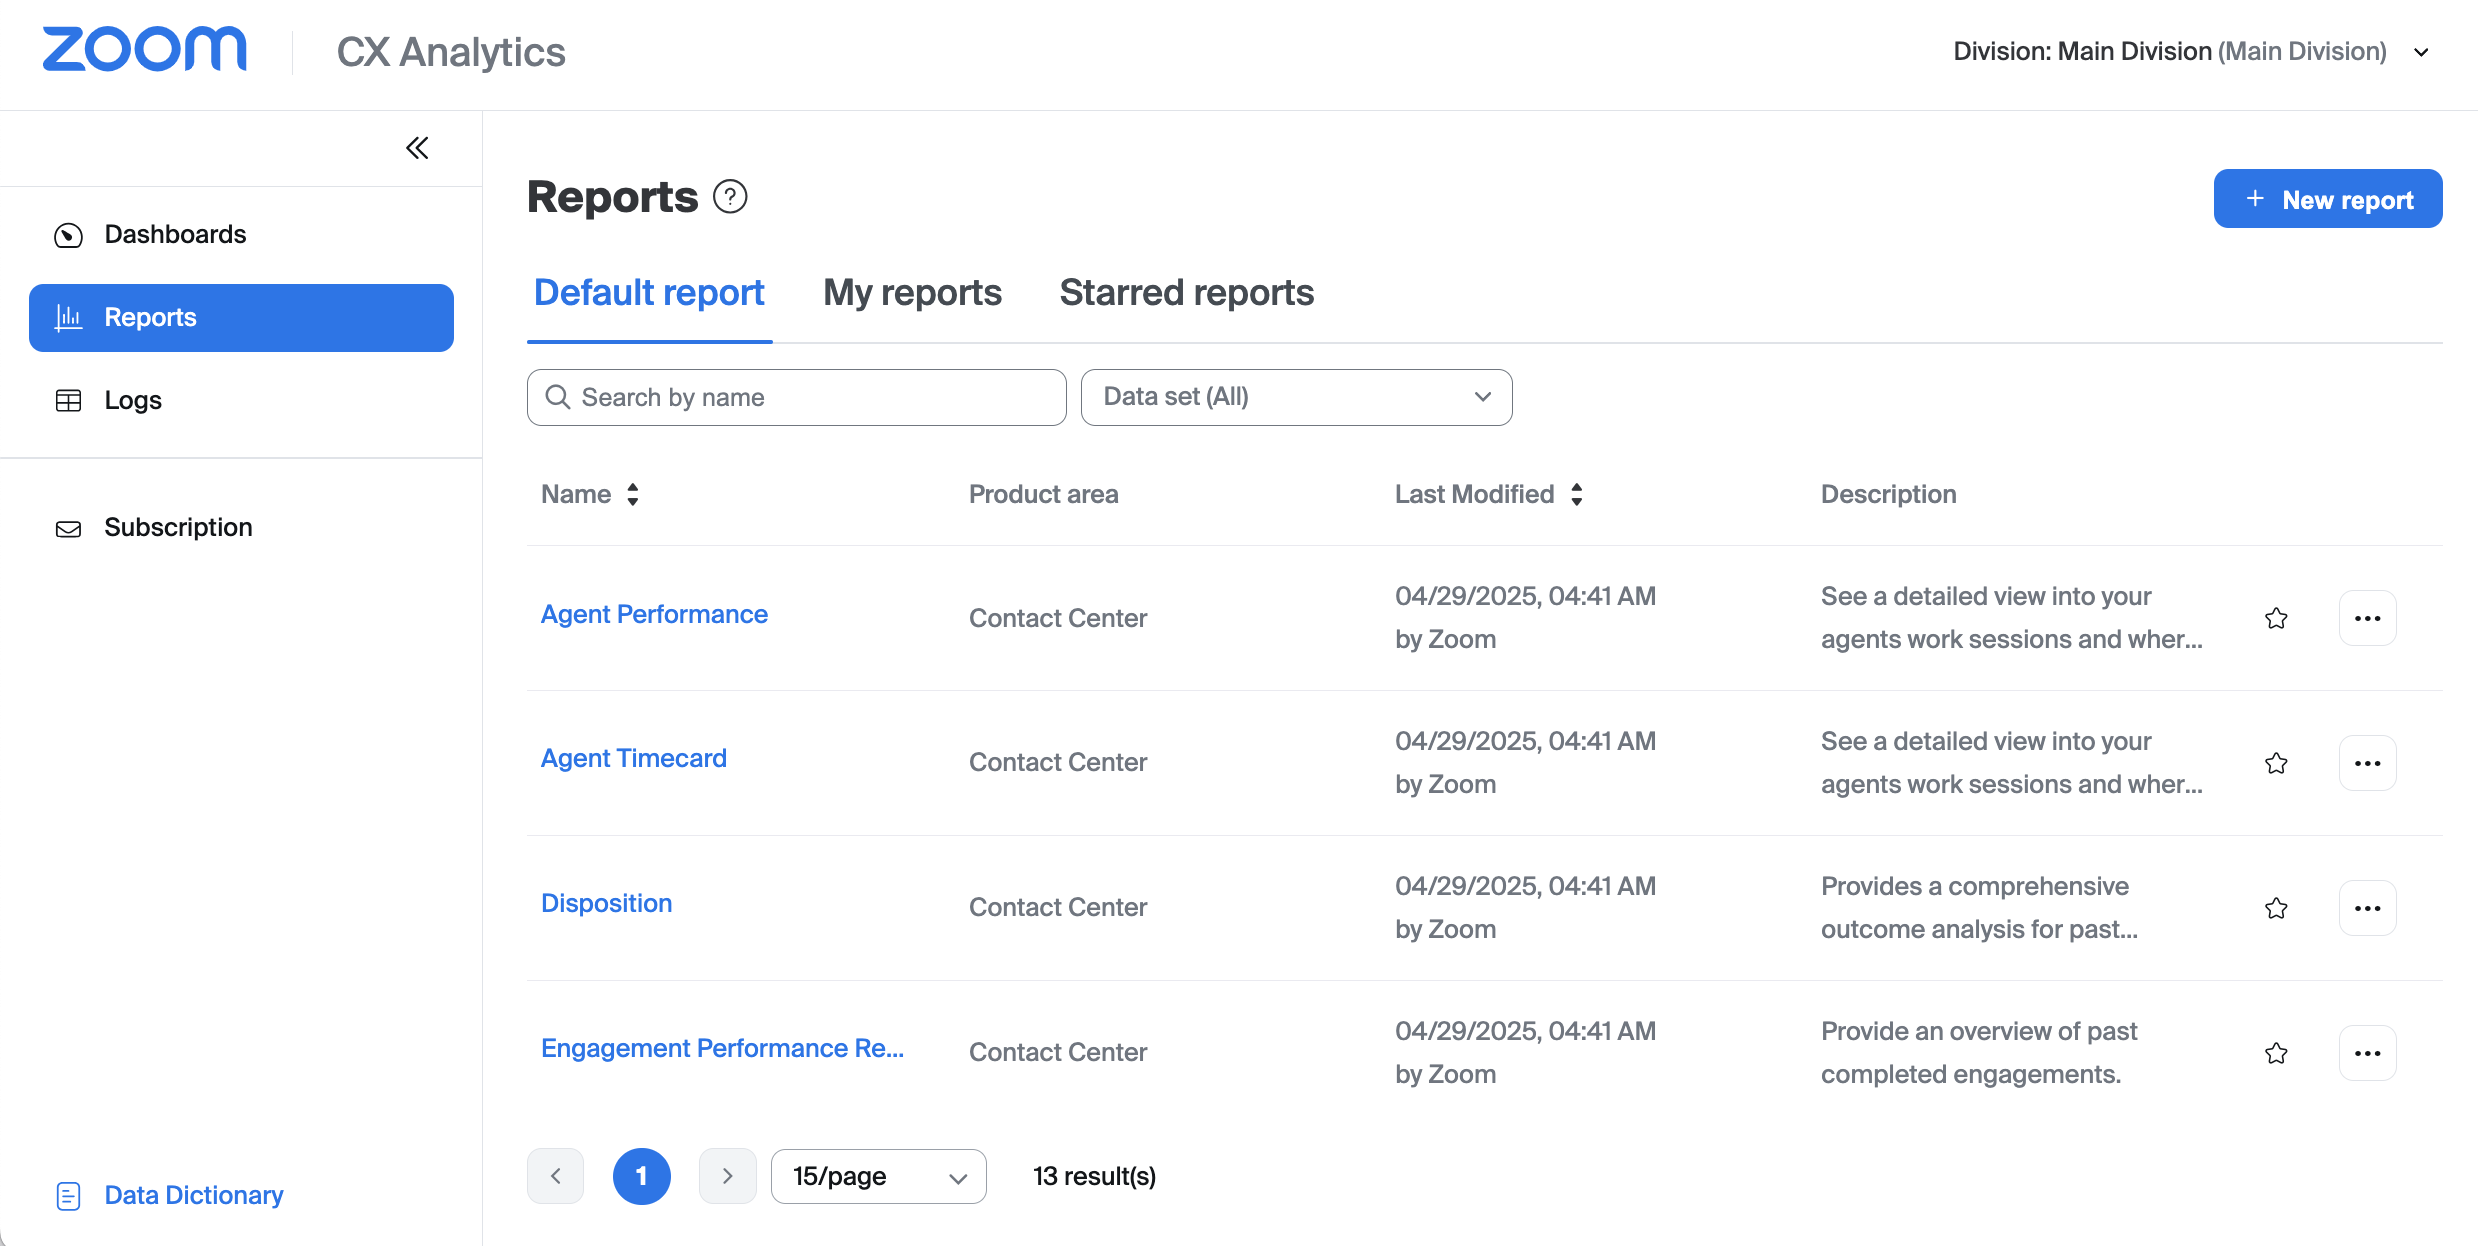
To open a default report simply click the report title from the list. With the report open you can scroll down to view the various widgets available to you within that report.
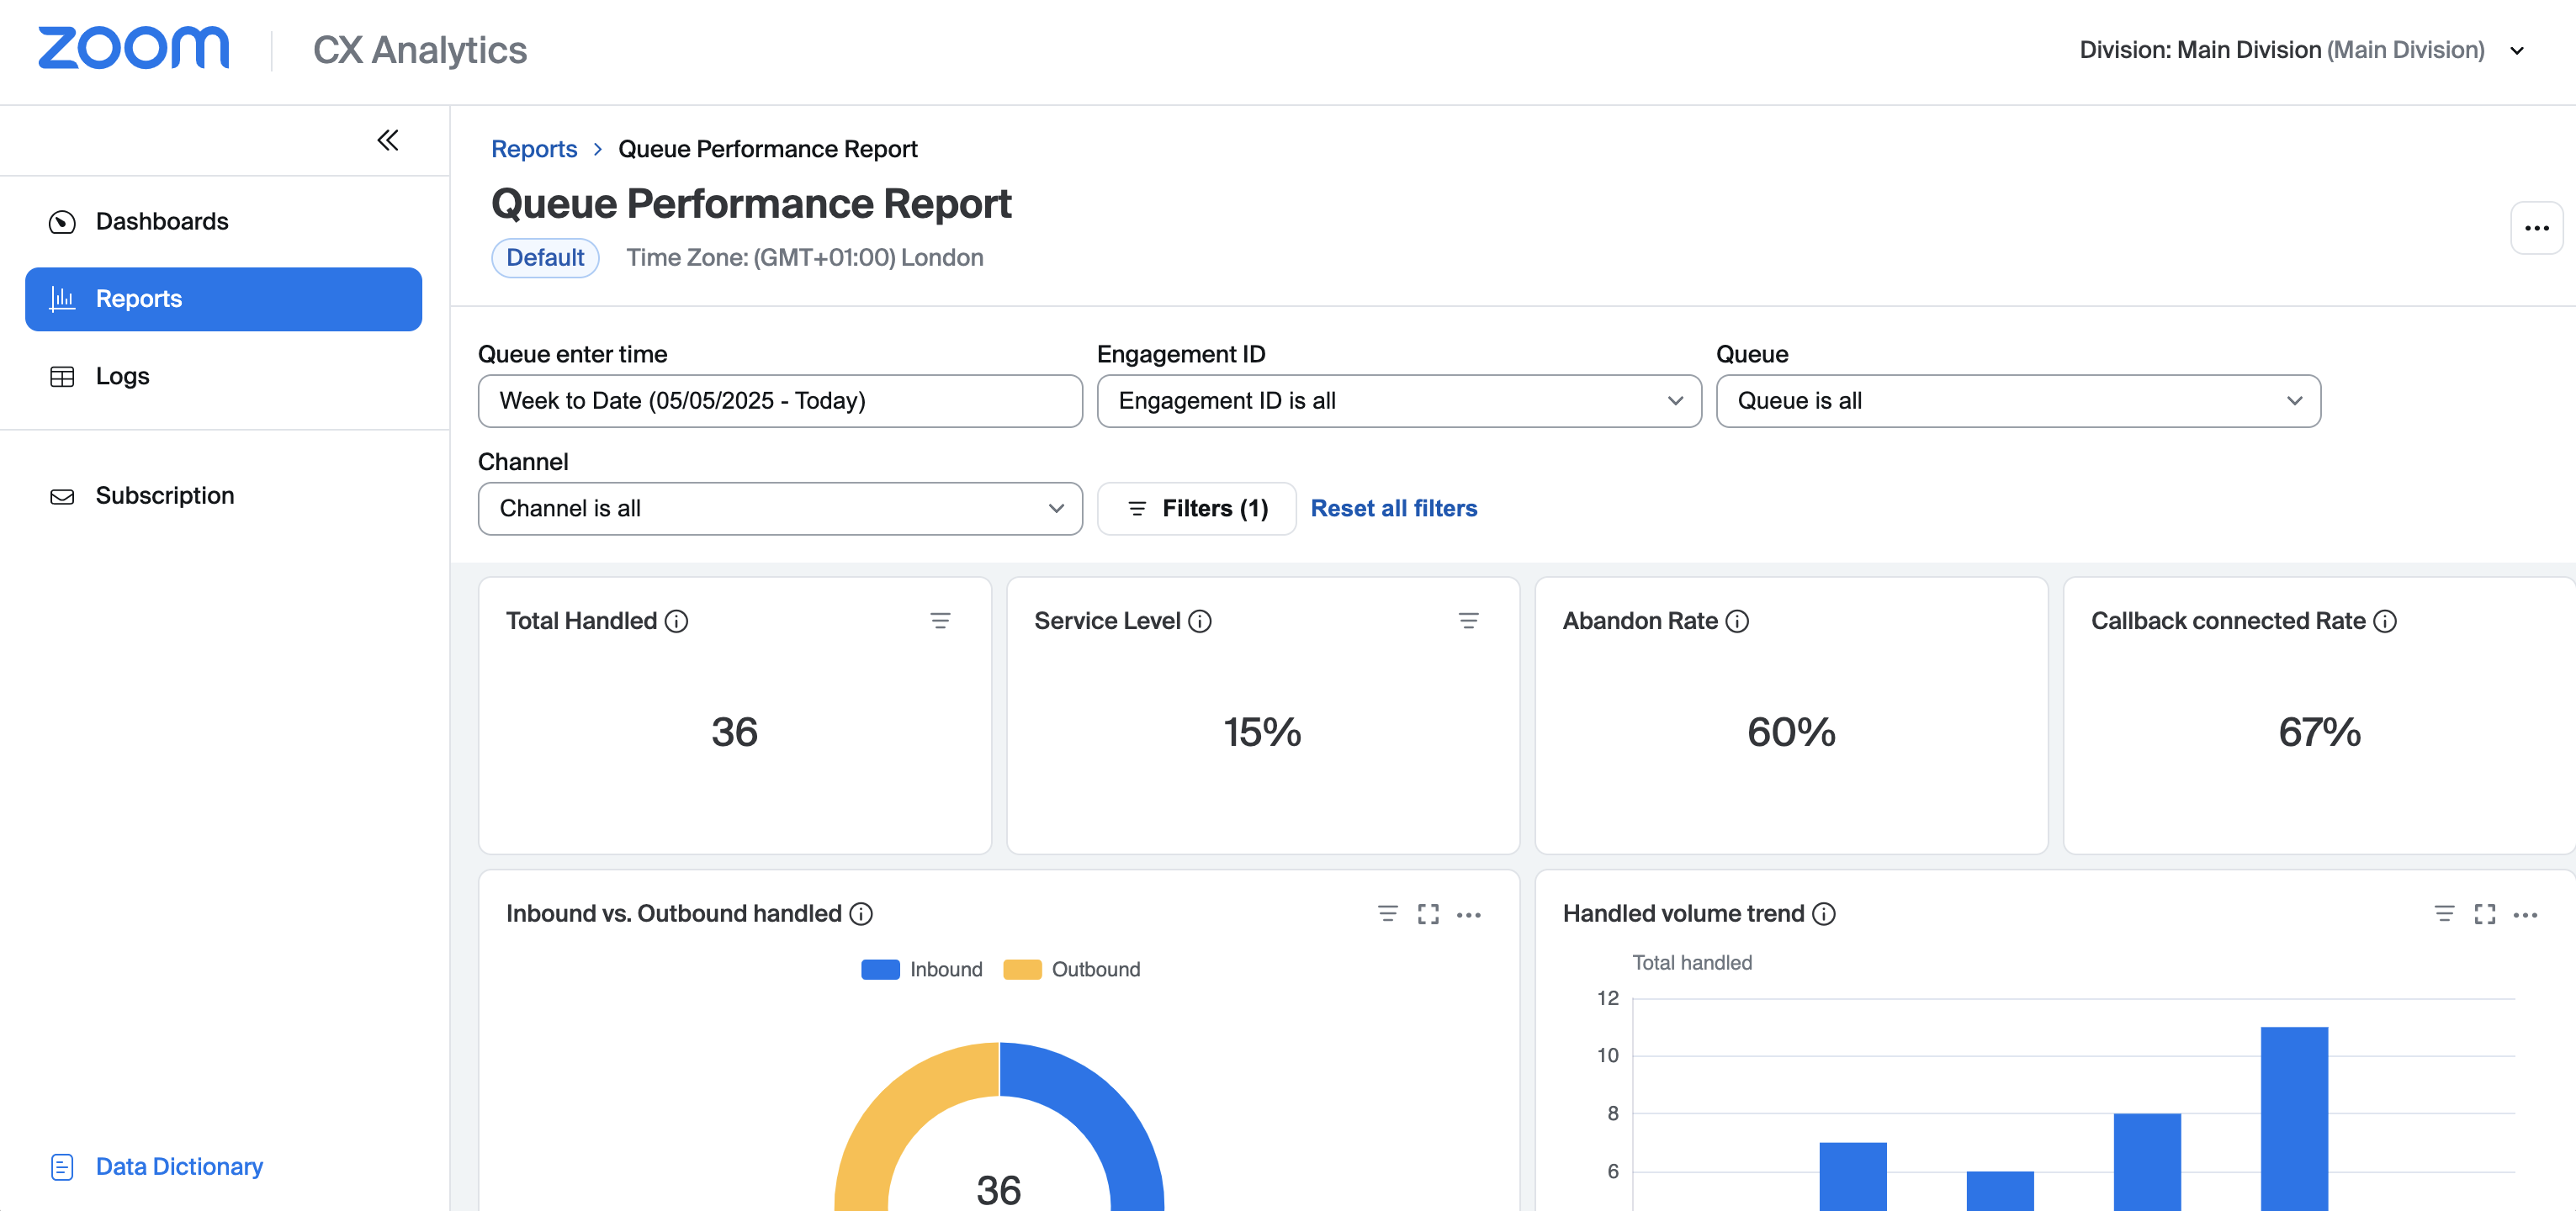
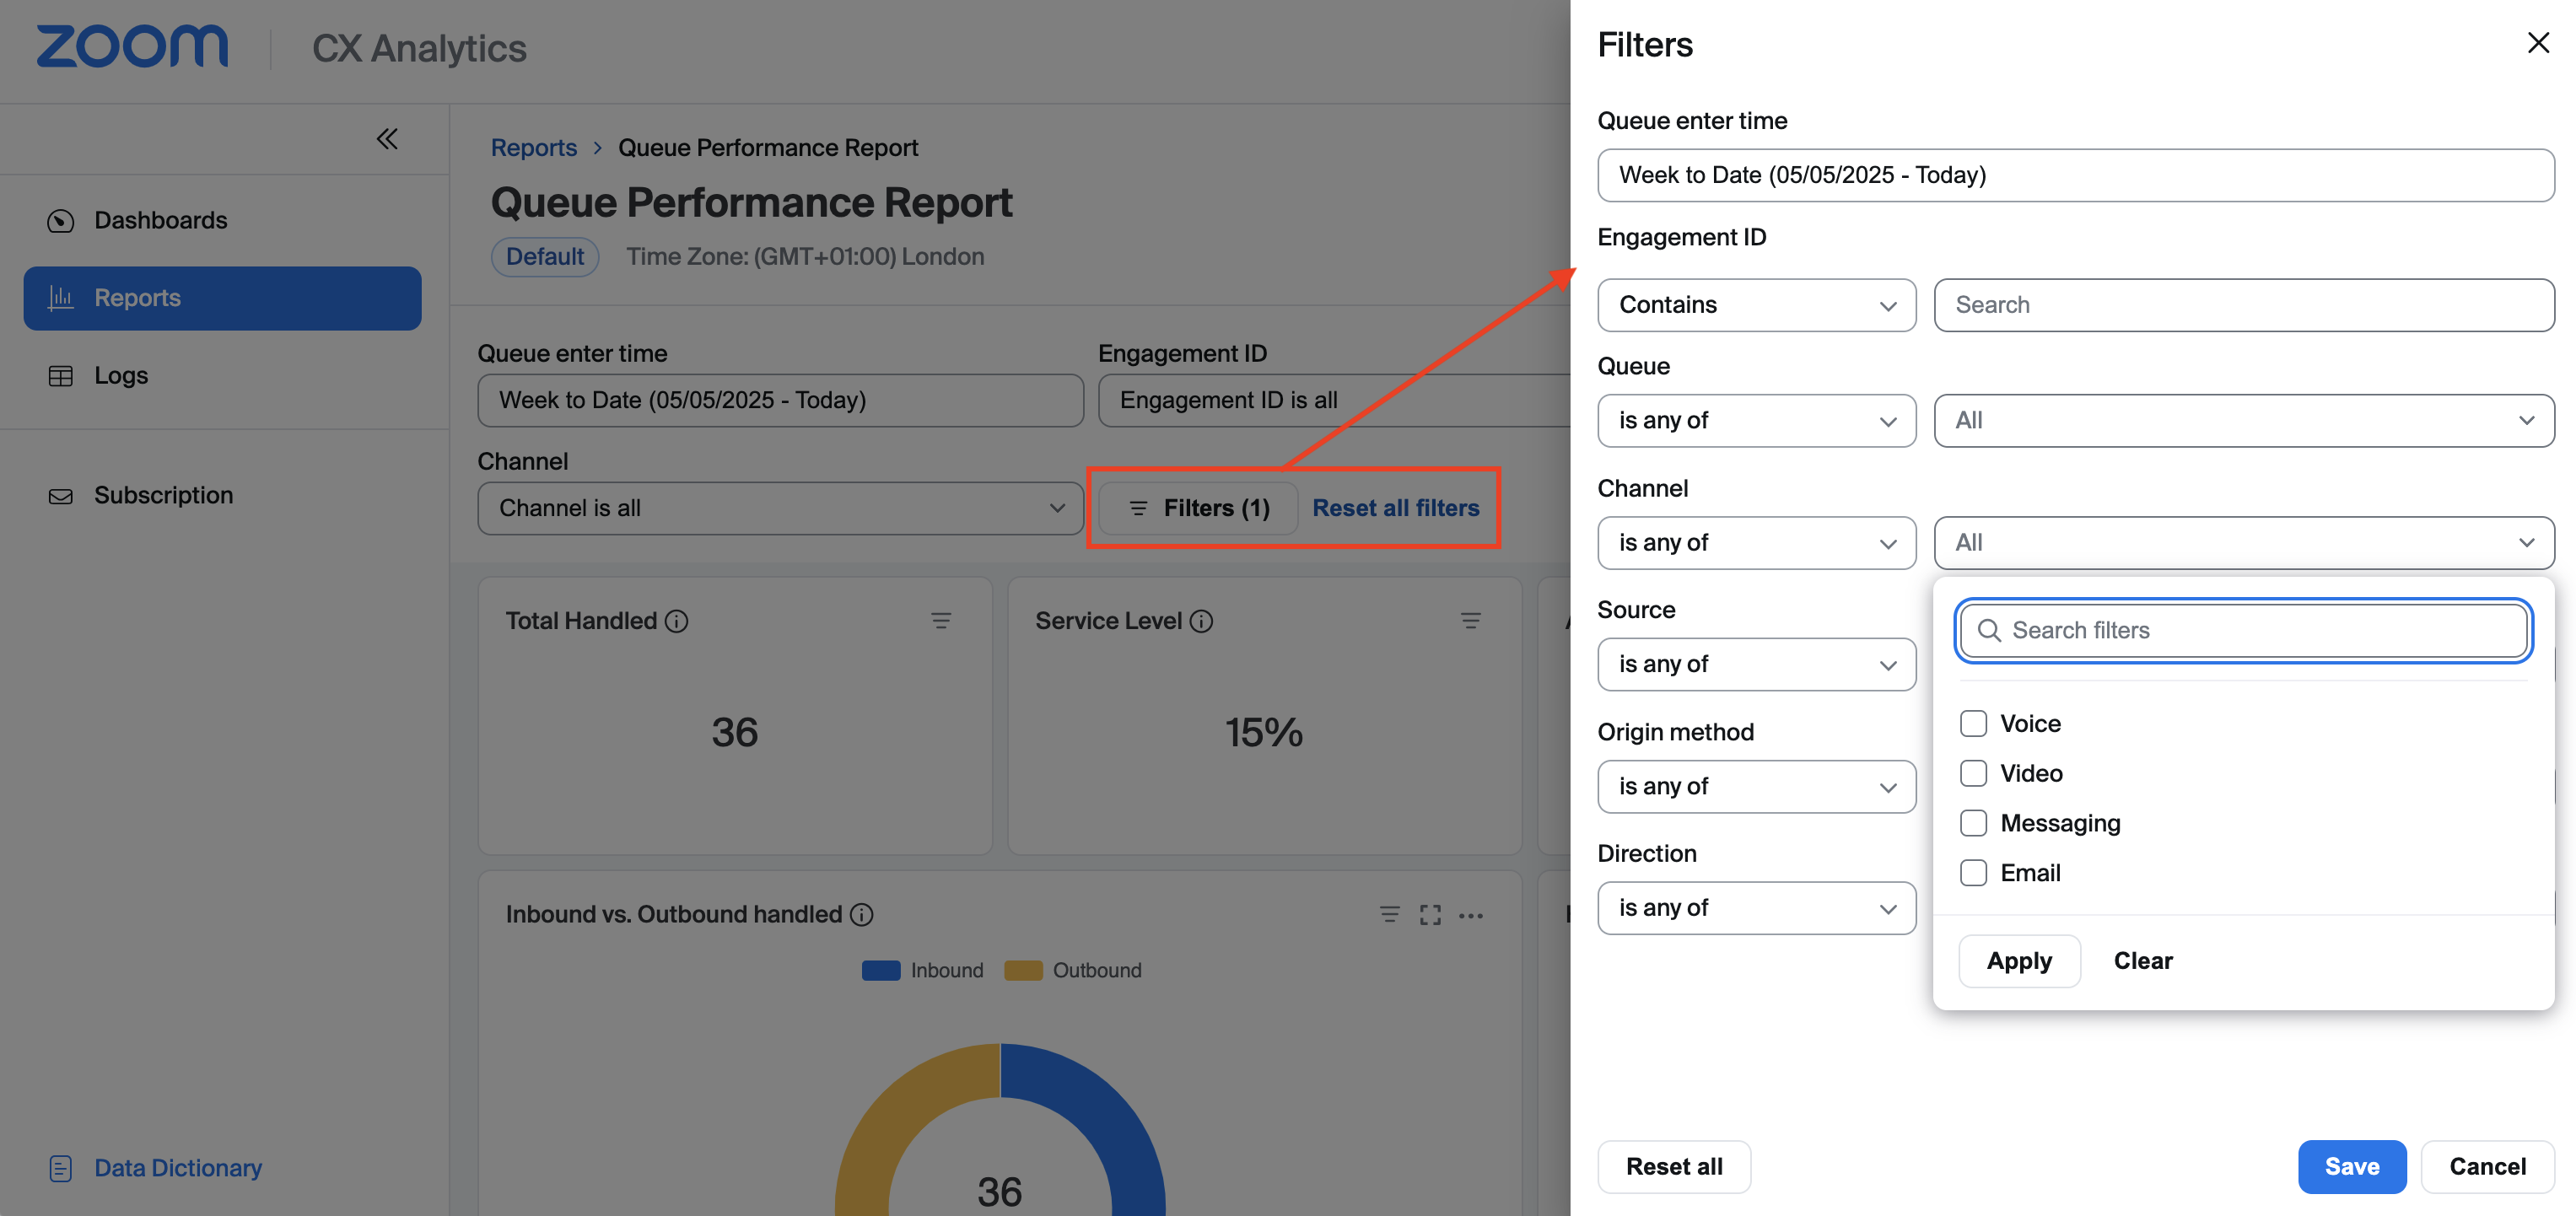
You can also adjust the default filters that appear at the top of the report, and use the Filters button for more advanced filtering of data.
Creating a New Report
CX Analytics enables you to create customized reports that are tailored to your requirements. In this section we will guide you through the process of creating a quick example report which will get you started. To create a new report:
1. Navigate to Reports in the left-hand navigation menu.
2. Click +New report.
3. Give the report a name and an optional description.
4. Select the Queue Inbound dataset from the drop-down list.
Note: The dataset you select will dictate which reporting data and metrics are available in your report. Select a dataset according to the type of report you'd like to run. For example, if you would like to create a report which focused on inbound traffic into your queues, then select the Queue Inbound dataset.
For further information about datasets please visit the section entitled How to view the Zoom Contact Center CX Analytics reports in the support article which is available at this link.
5. Click the Add button. You should be presented with the newly created report ready to start building.
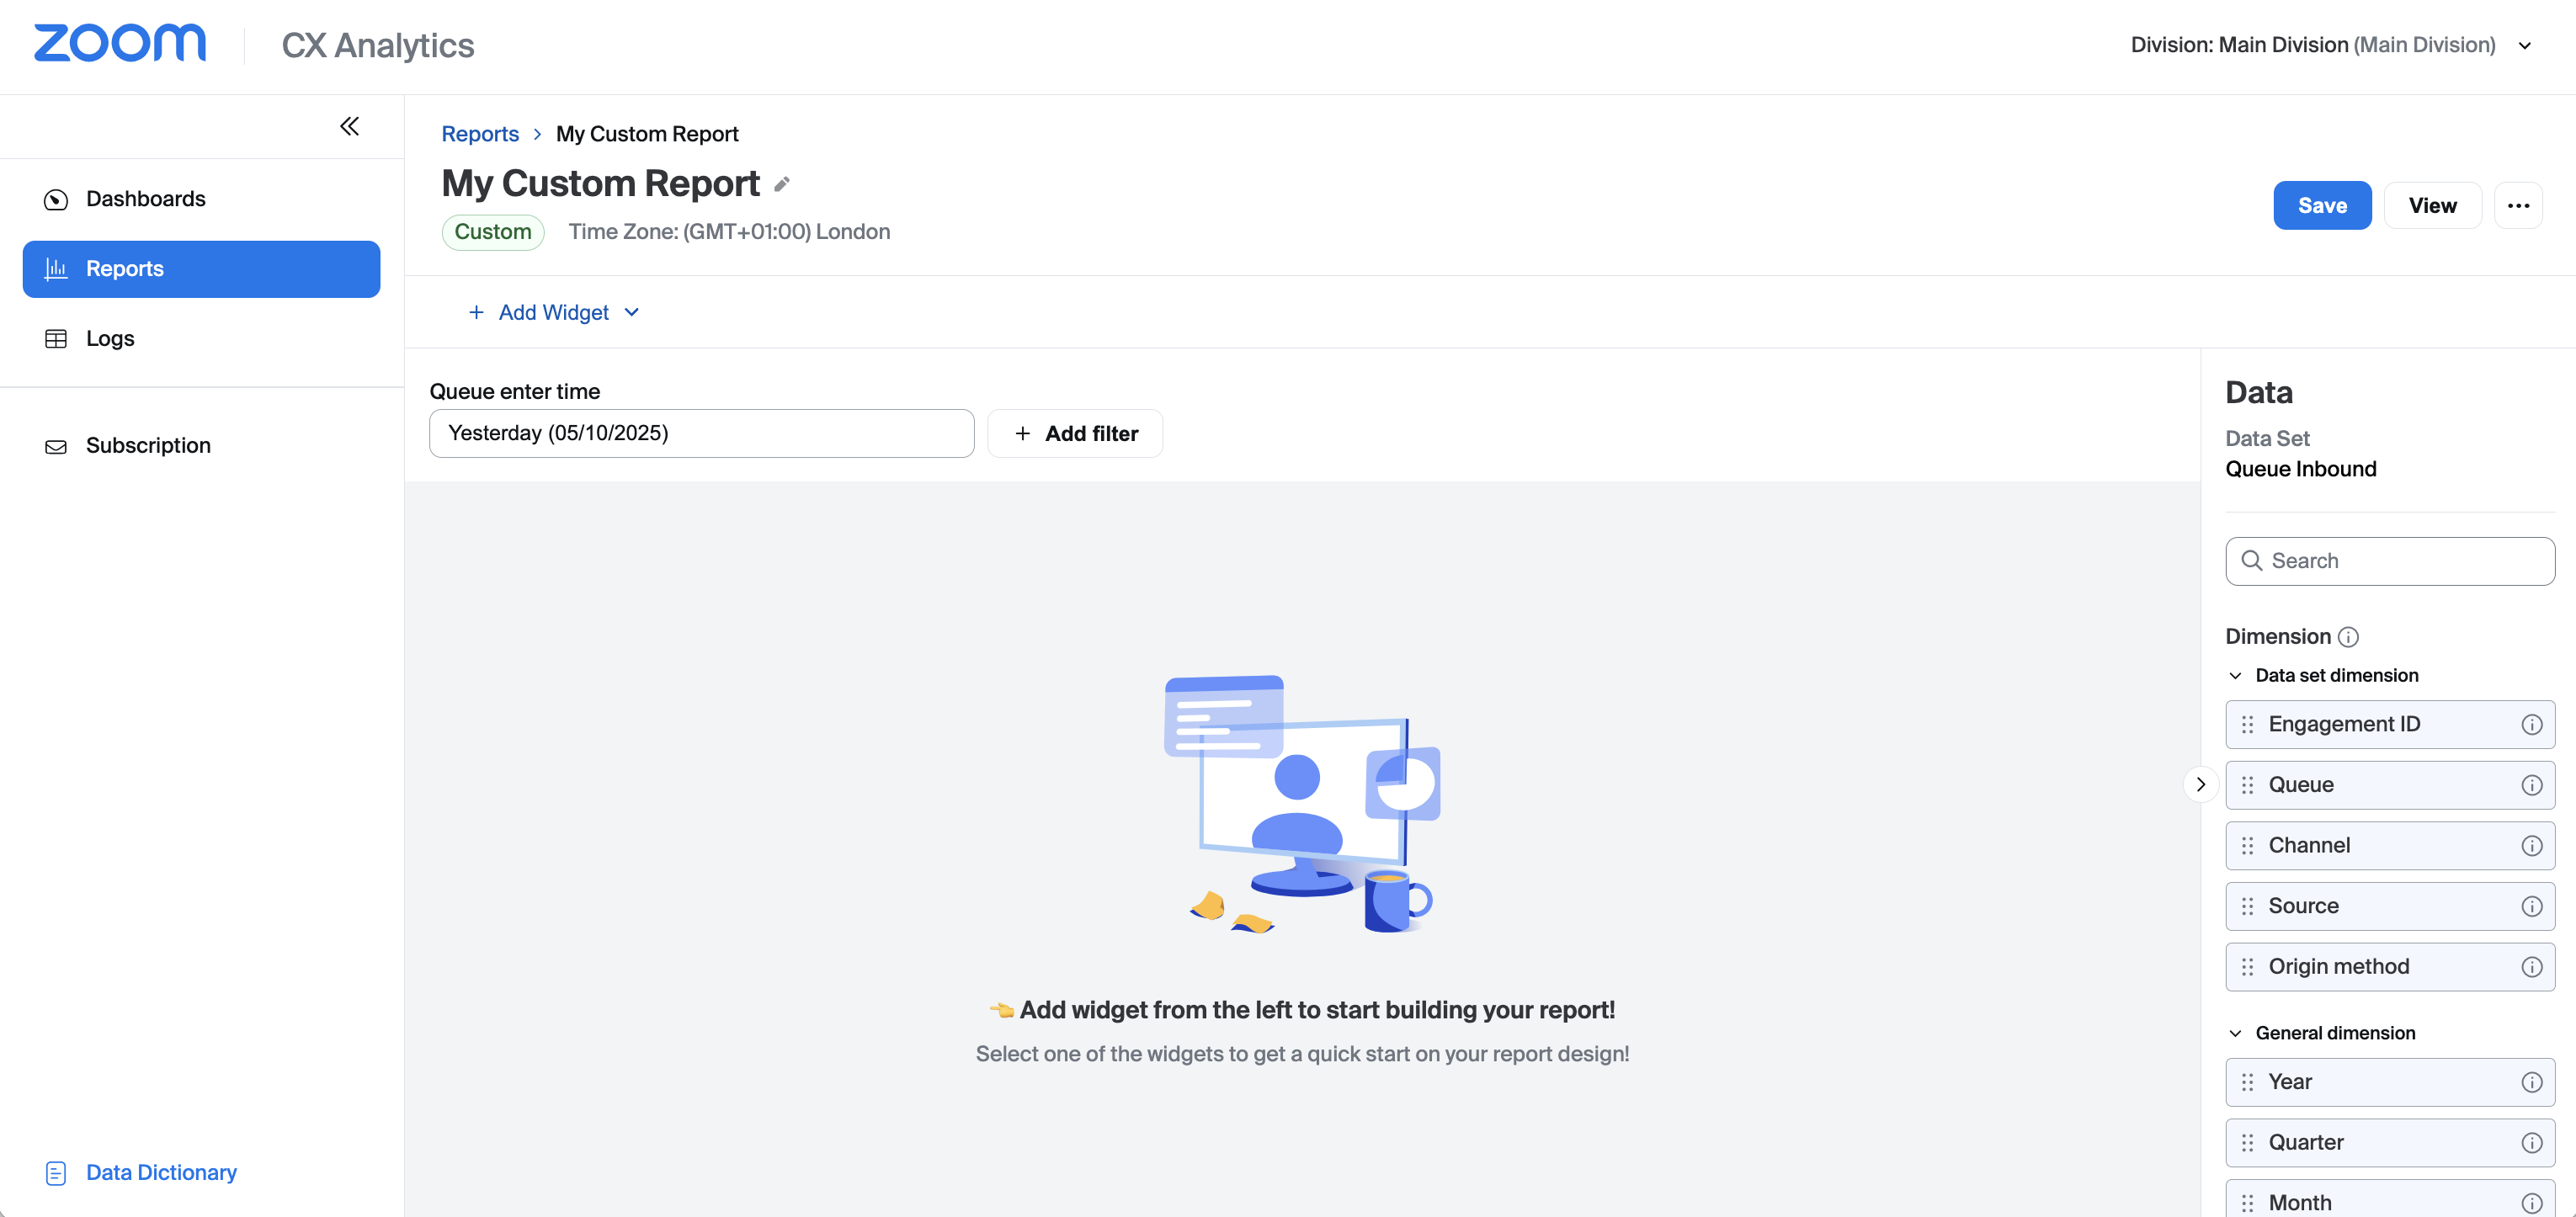
On the right-hand side of the report editor you'll find a list of the dimensions and metrics available in your selected dataset.
6. Click +Add Widget.
7. Select the Tabular widget.
8. Scroll down to the General dimension section, then drag and drop the Day dimension into the Group by section.
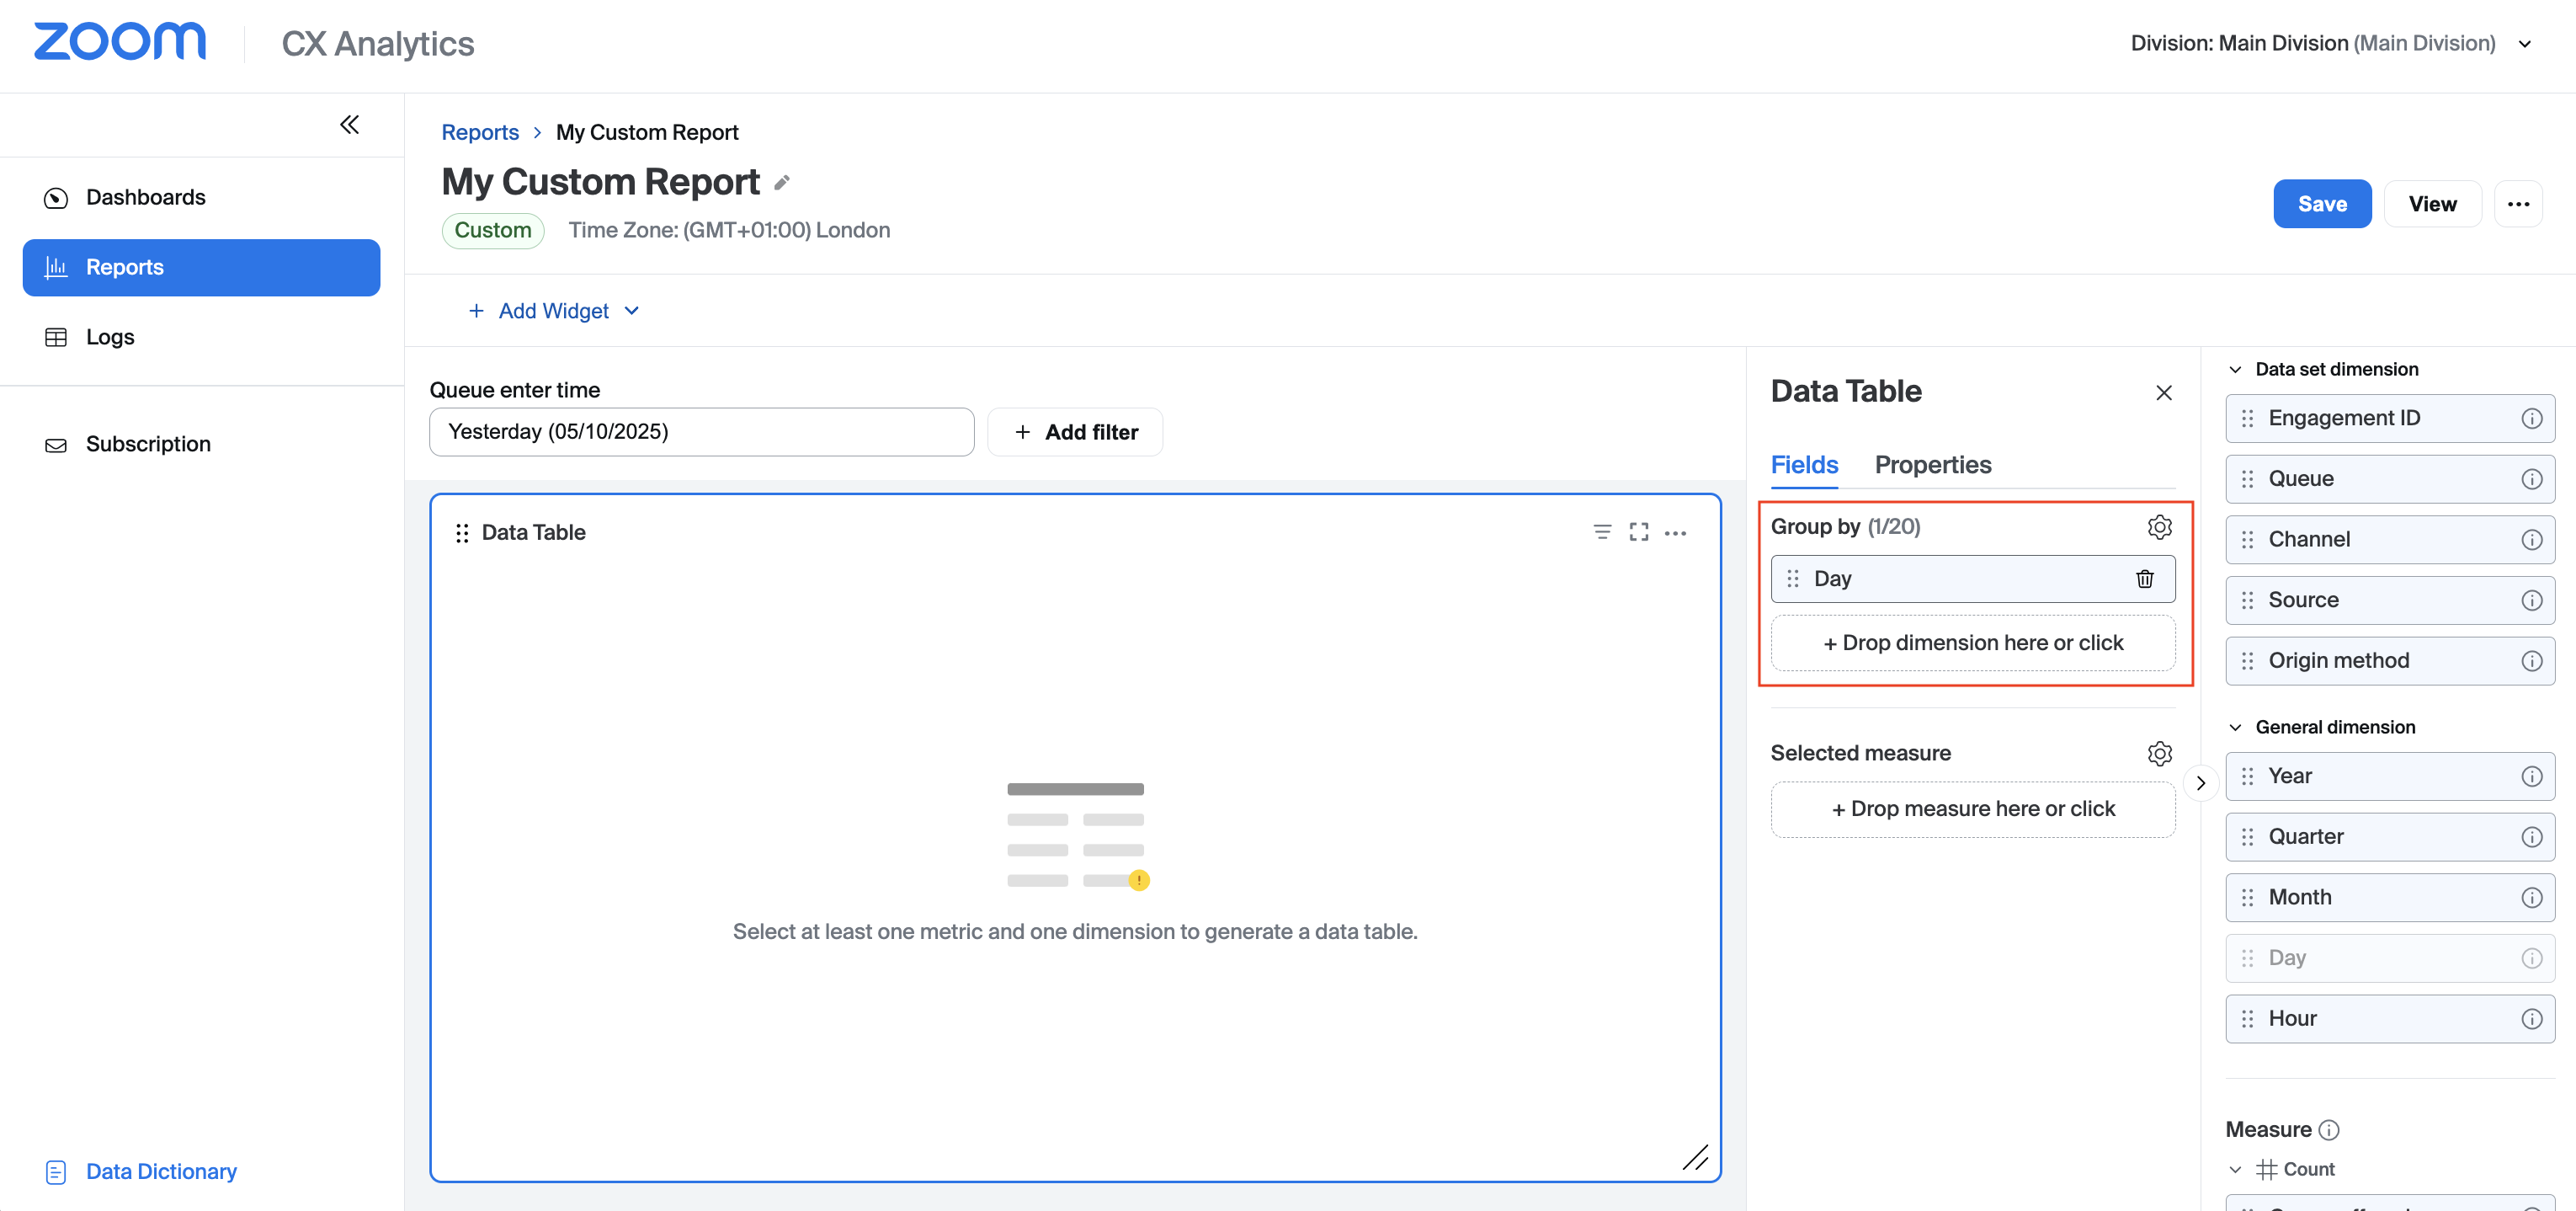
9. In the Selected measure section, click +Drop measure here or click to start adding metrics to your report.
10. Click the check mark next to the Metric Name field to add all fields to your report.
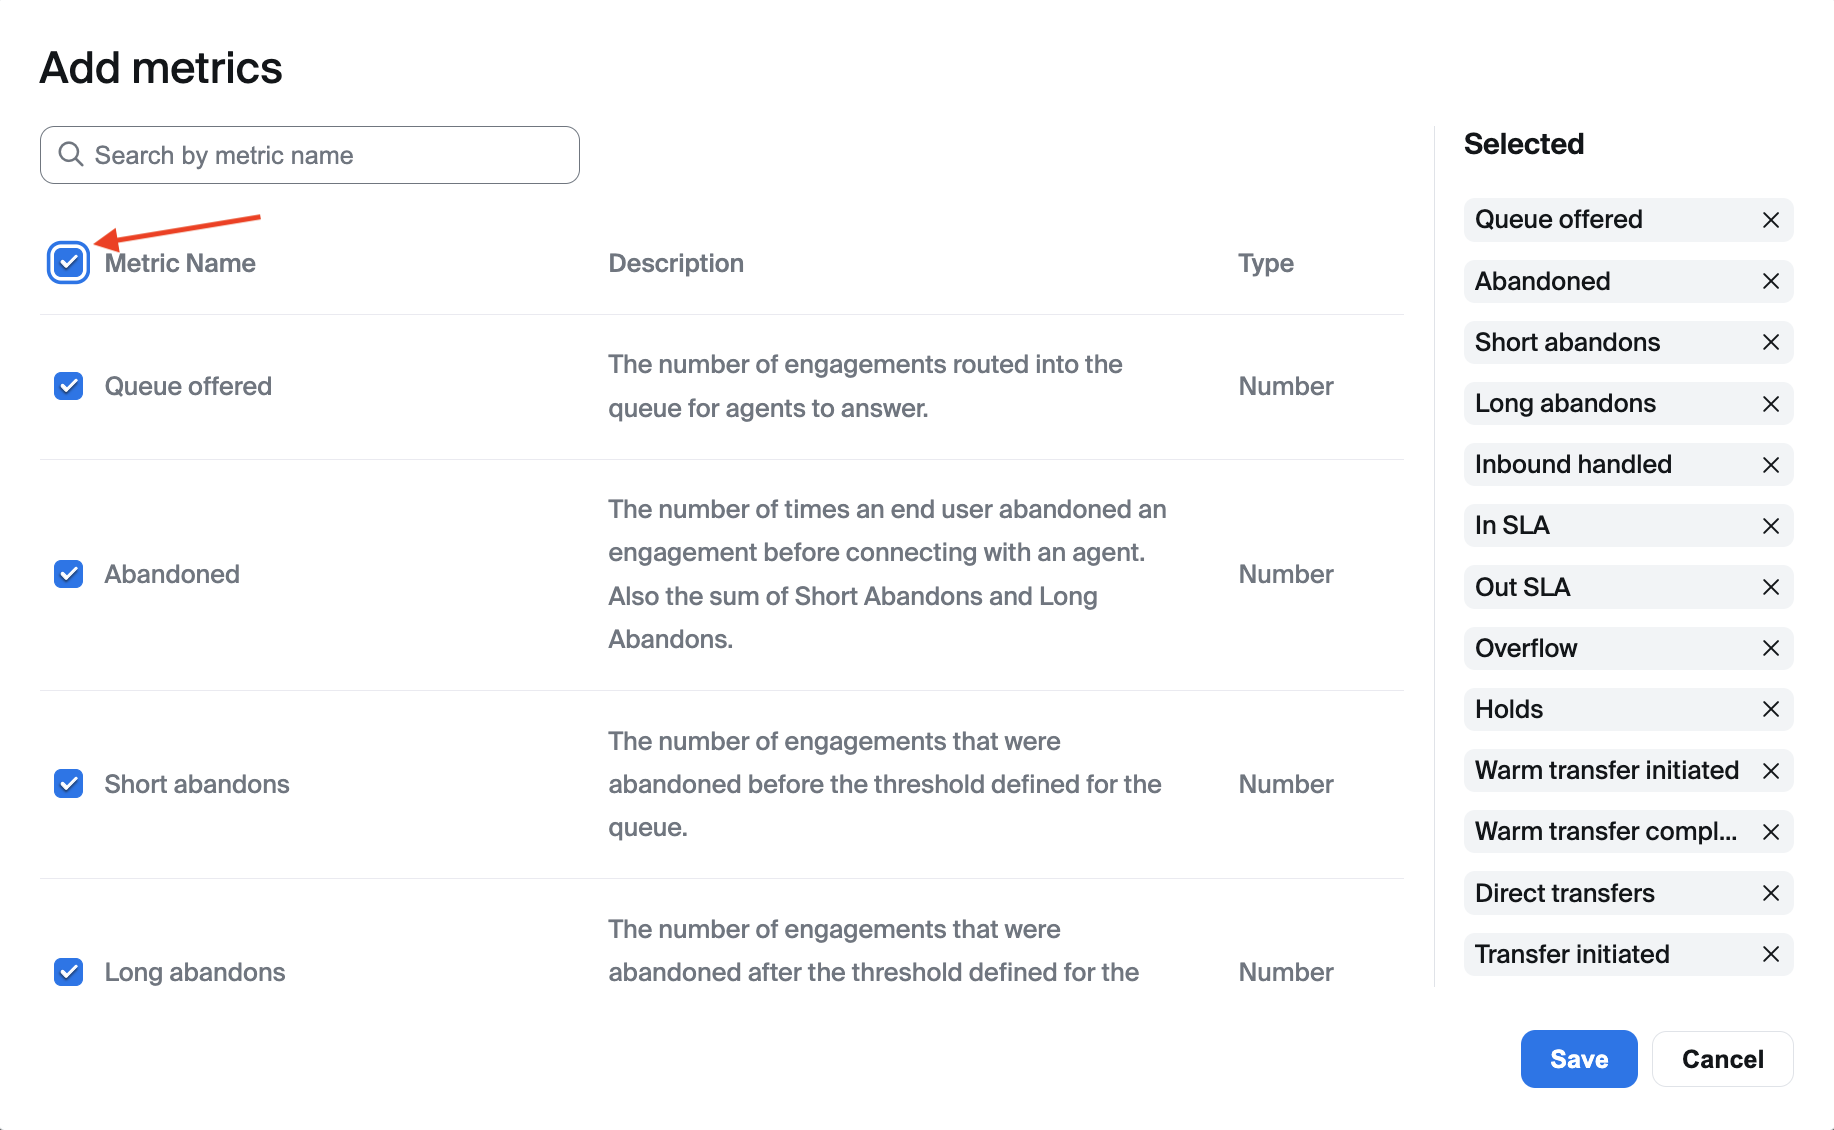
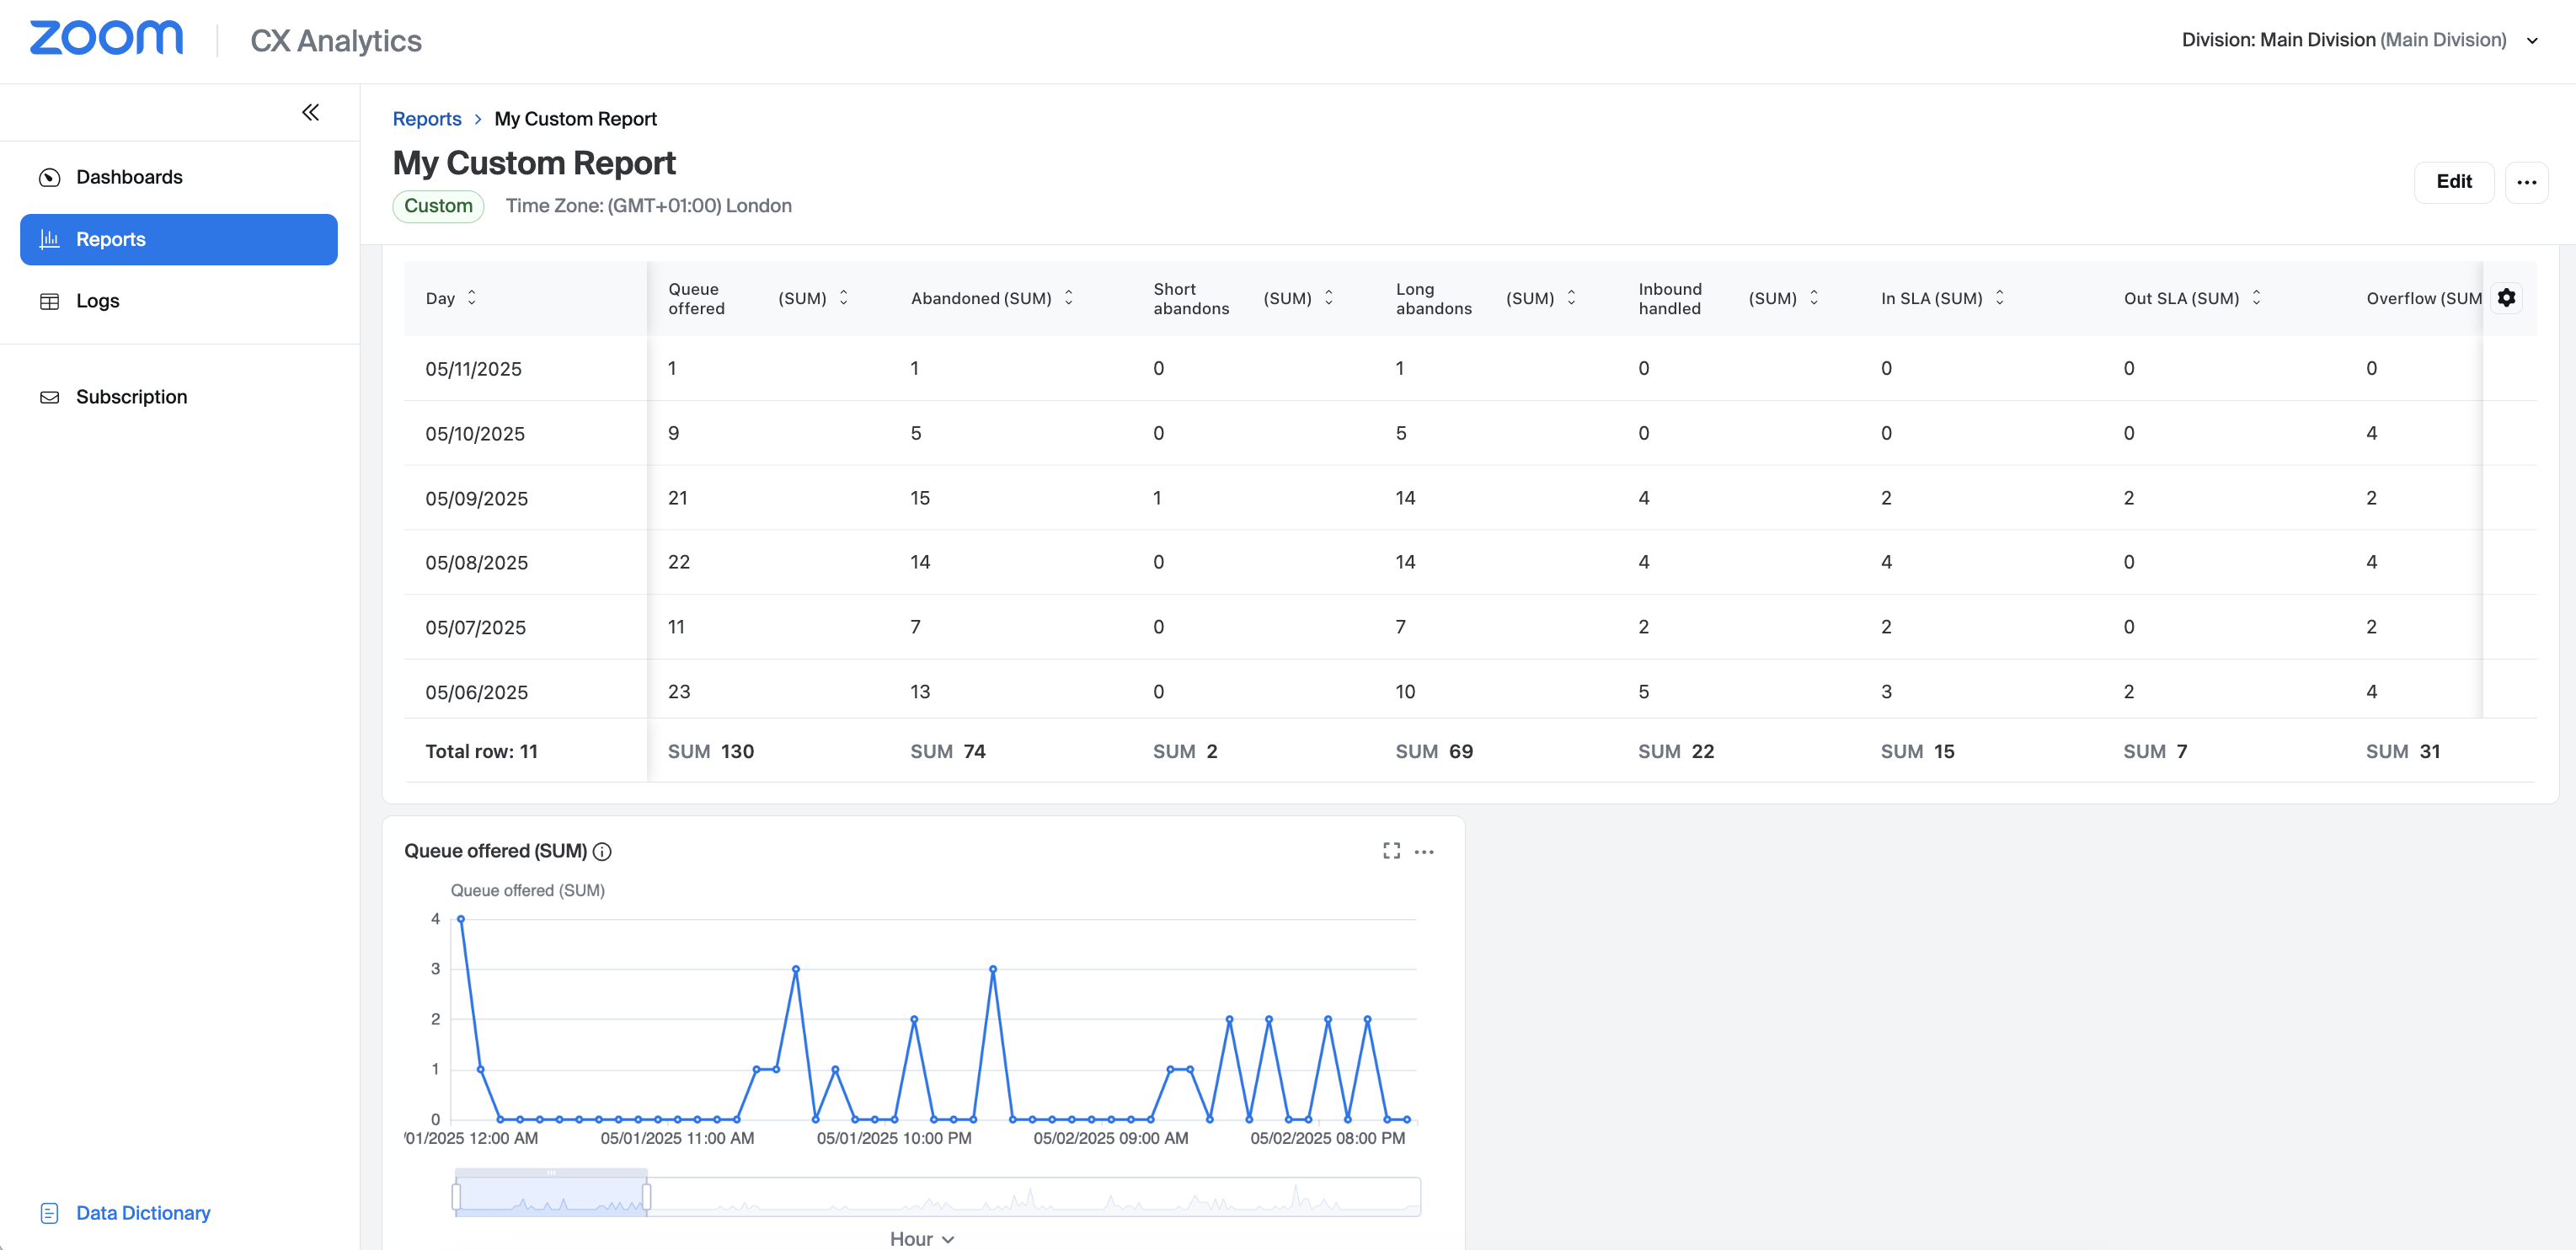
11. Click Save. At this point you should see some reporting data in the newly created table.
12. Click the date field in the section labelled Queue enter time to display a date picker. Select the option Month to Date to display all data within the current month, grouped by day.
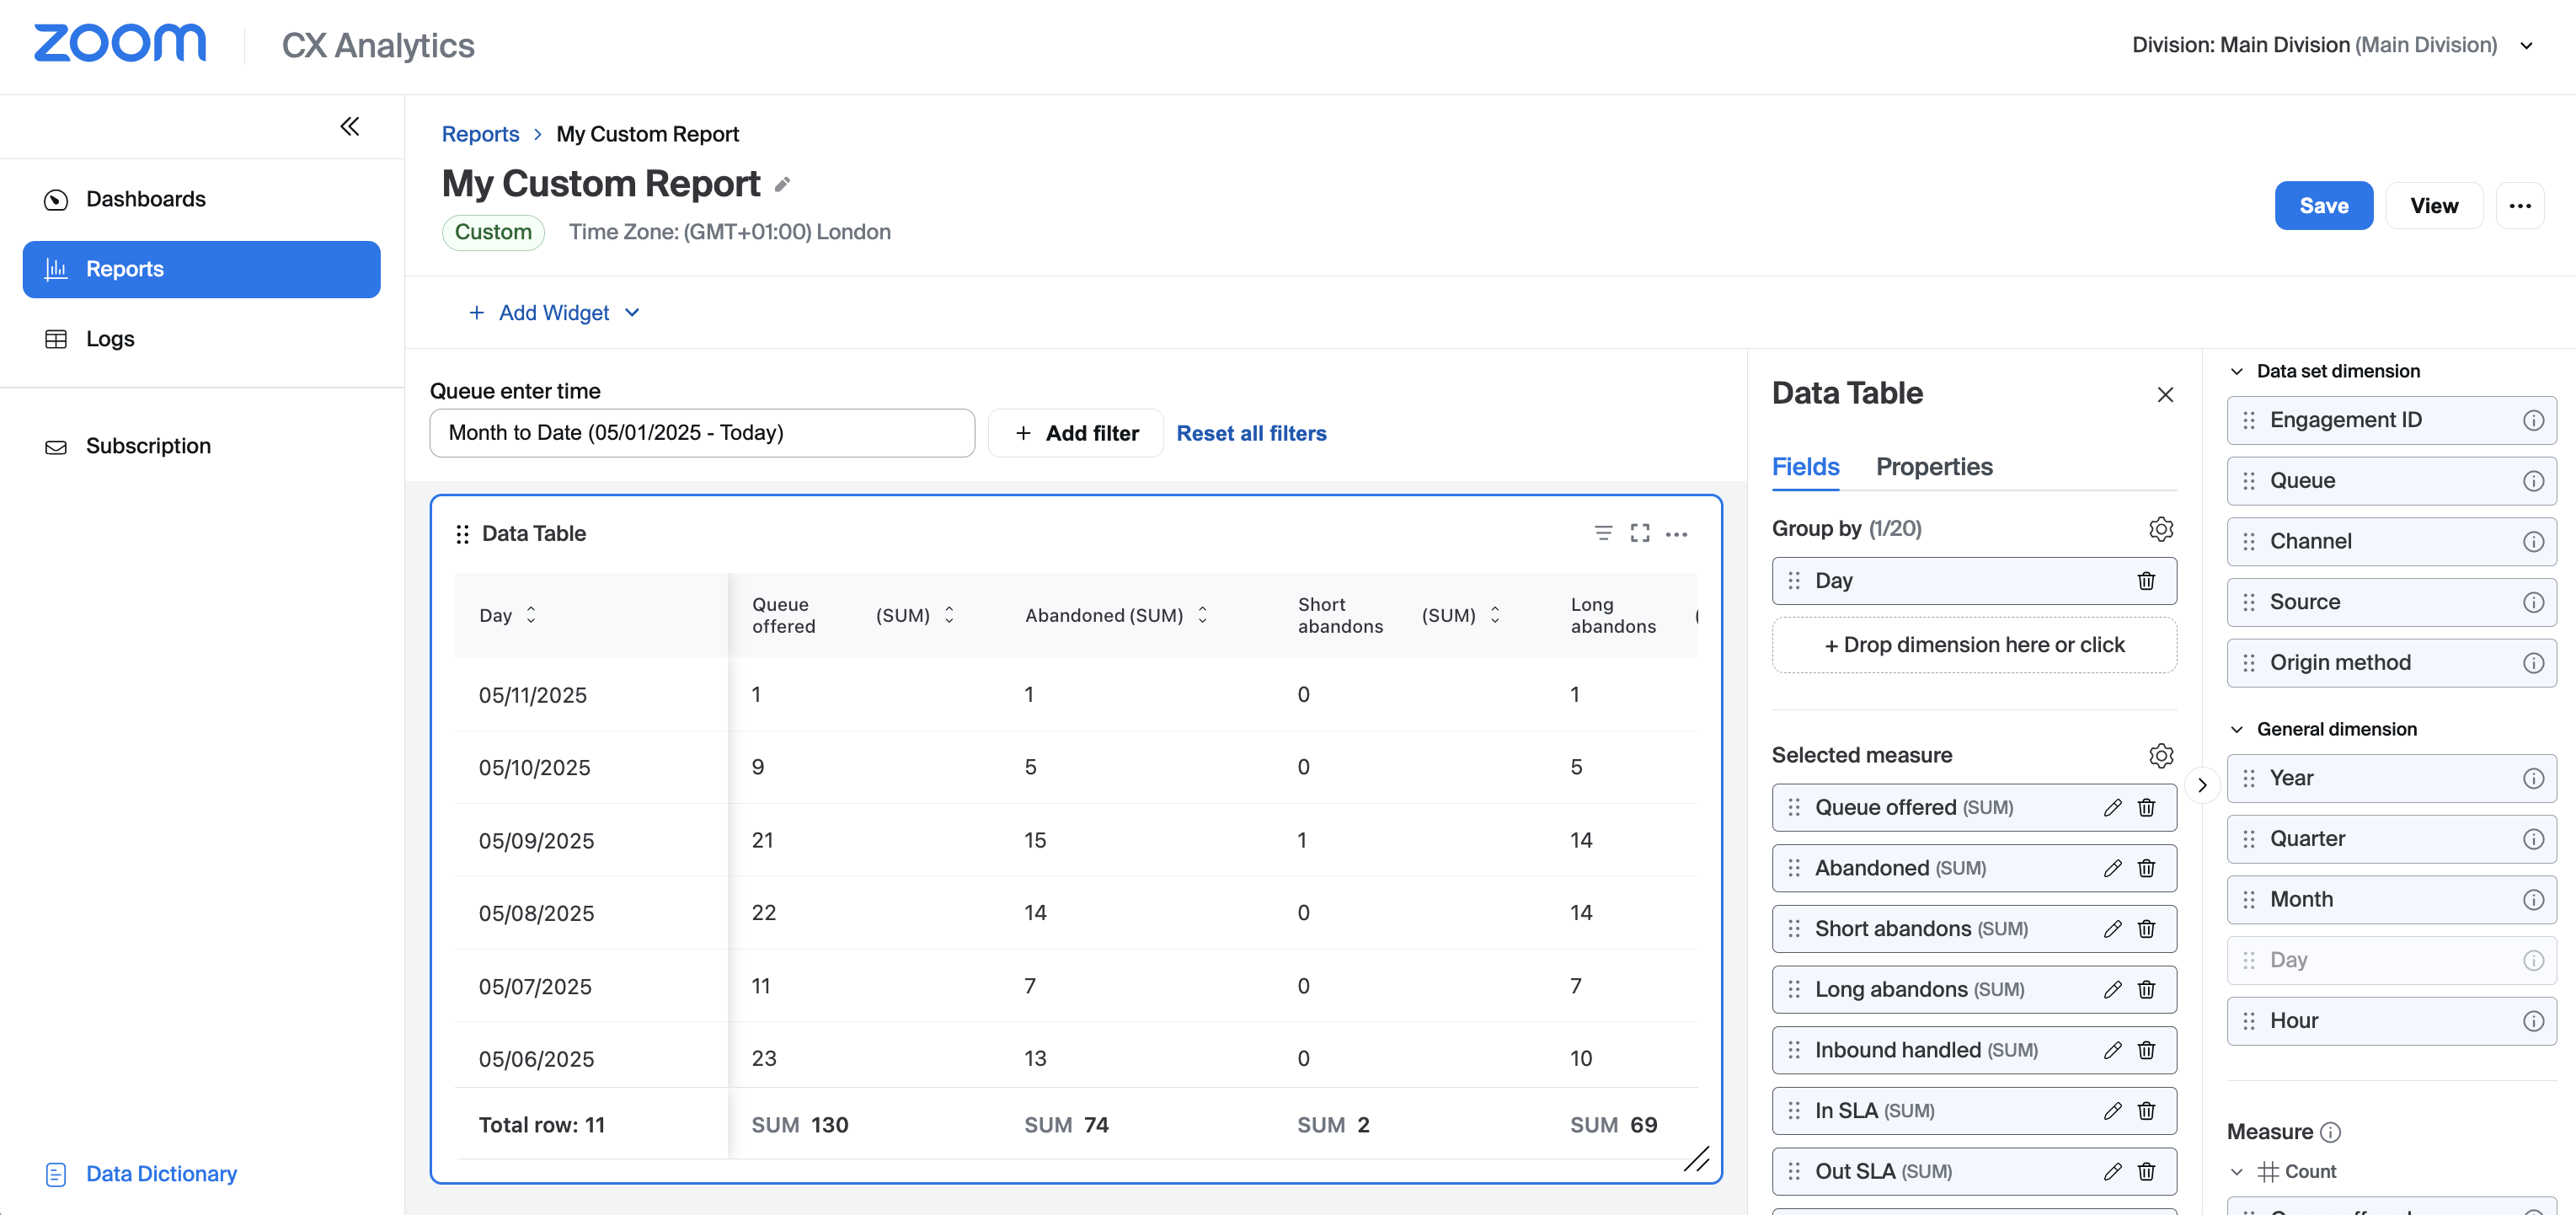
13. Click +Add Widget.
14. Select the Line chart widget.
15. Scroll down to the General dimension section, then drag and drop the Hour dimension into the X-axis (Dimension) section.
16. Scroll down to the Measure section, then drag and drop the Queue offered measure into the Y-axis (Measure) section.
17. Repeat the above steps for any further widgets you'd like to add to the report.
18. Click Save followed by View to view your new report.
Duplicating Default Reports
If you would like to make any changes to a default report you can duplicate the report to make a copy, and then edit the copy.
1. Navigate to Reports in the left-hand navigation menu.
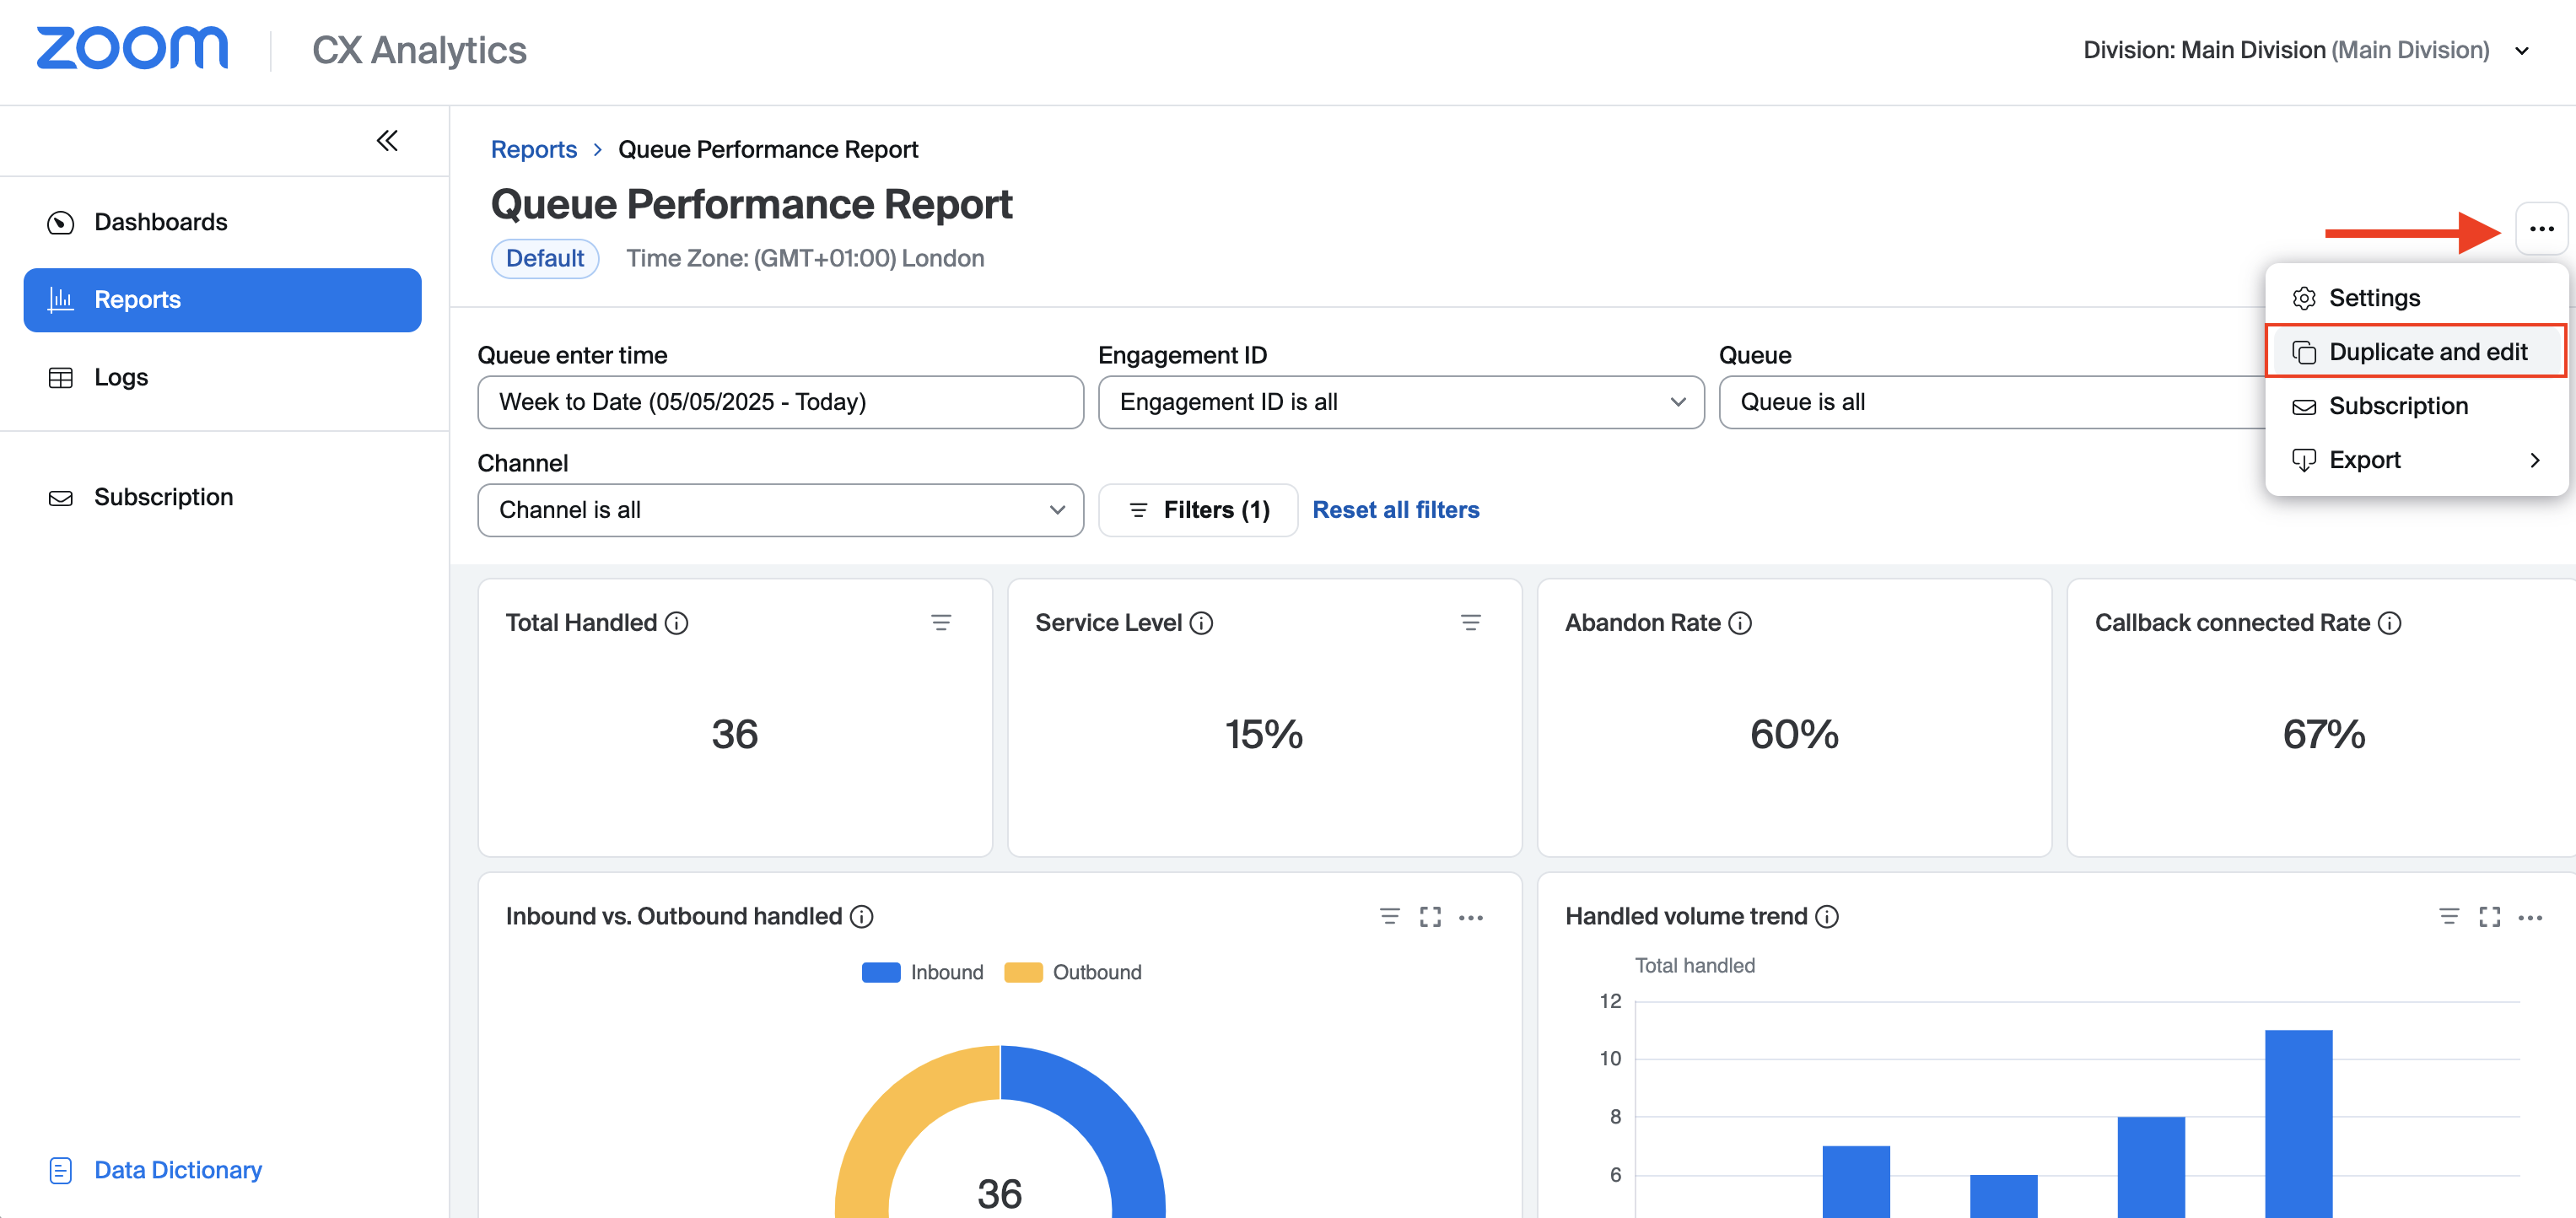
2. Open a default report that you'd like to customize.
3. Click the ellipsis on the top right-hand side of the report, then select Duplicate and edit from the drop-down menu.
4. Enter a name and optional description for the report, then click Confirm.
5. Click the Edit button.
6. At this point you can add/remove/edit widgets as needed to customize the report.
7. When finished, click Save followed by View to view the customized version of the default report. Once the report has been saved it can be found by navigating to Reports → My reports.
Creating Subscriptions
Subscriptions provide a way to have an historical report automatically sent to one or more email addresses on a regular basis. To subscribe to a report:
1. Navigate to Reports in the left-hand navigation menu.
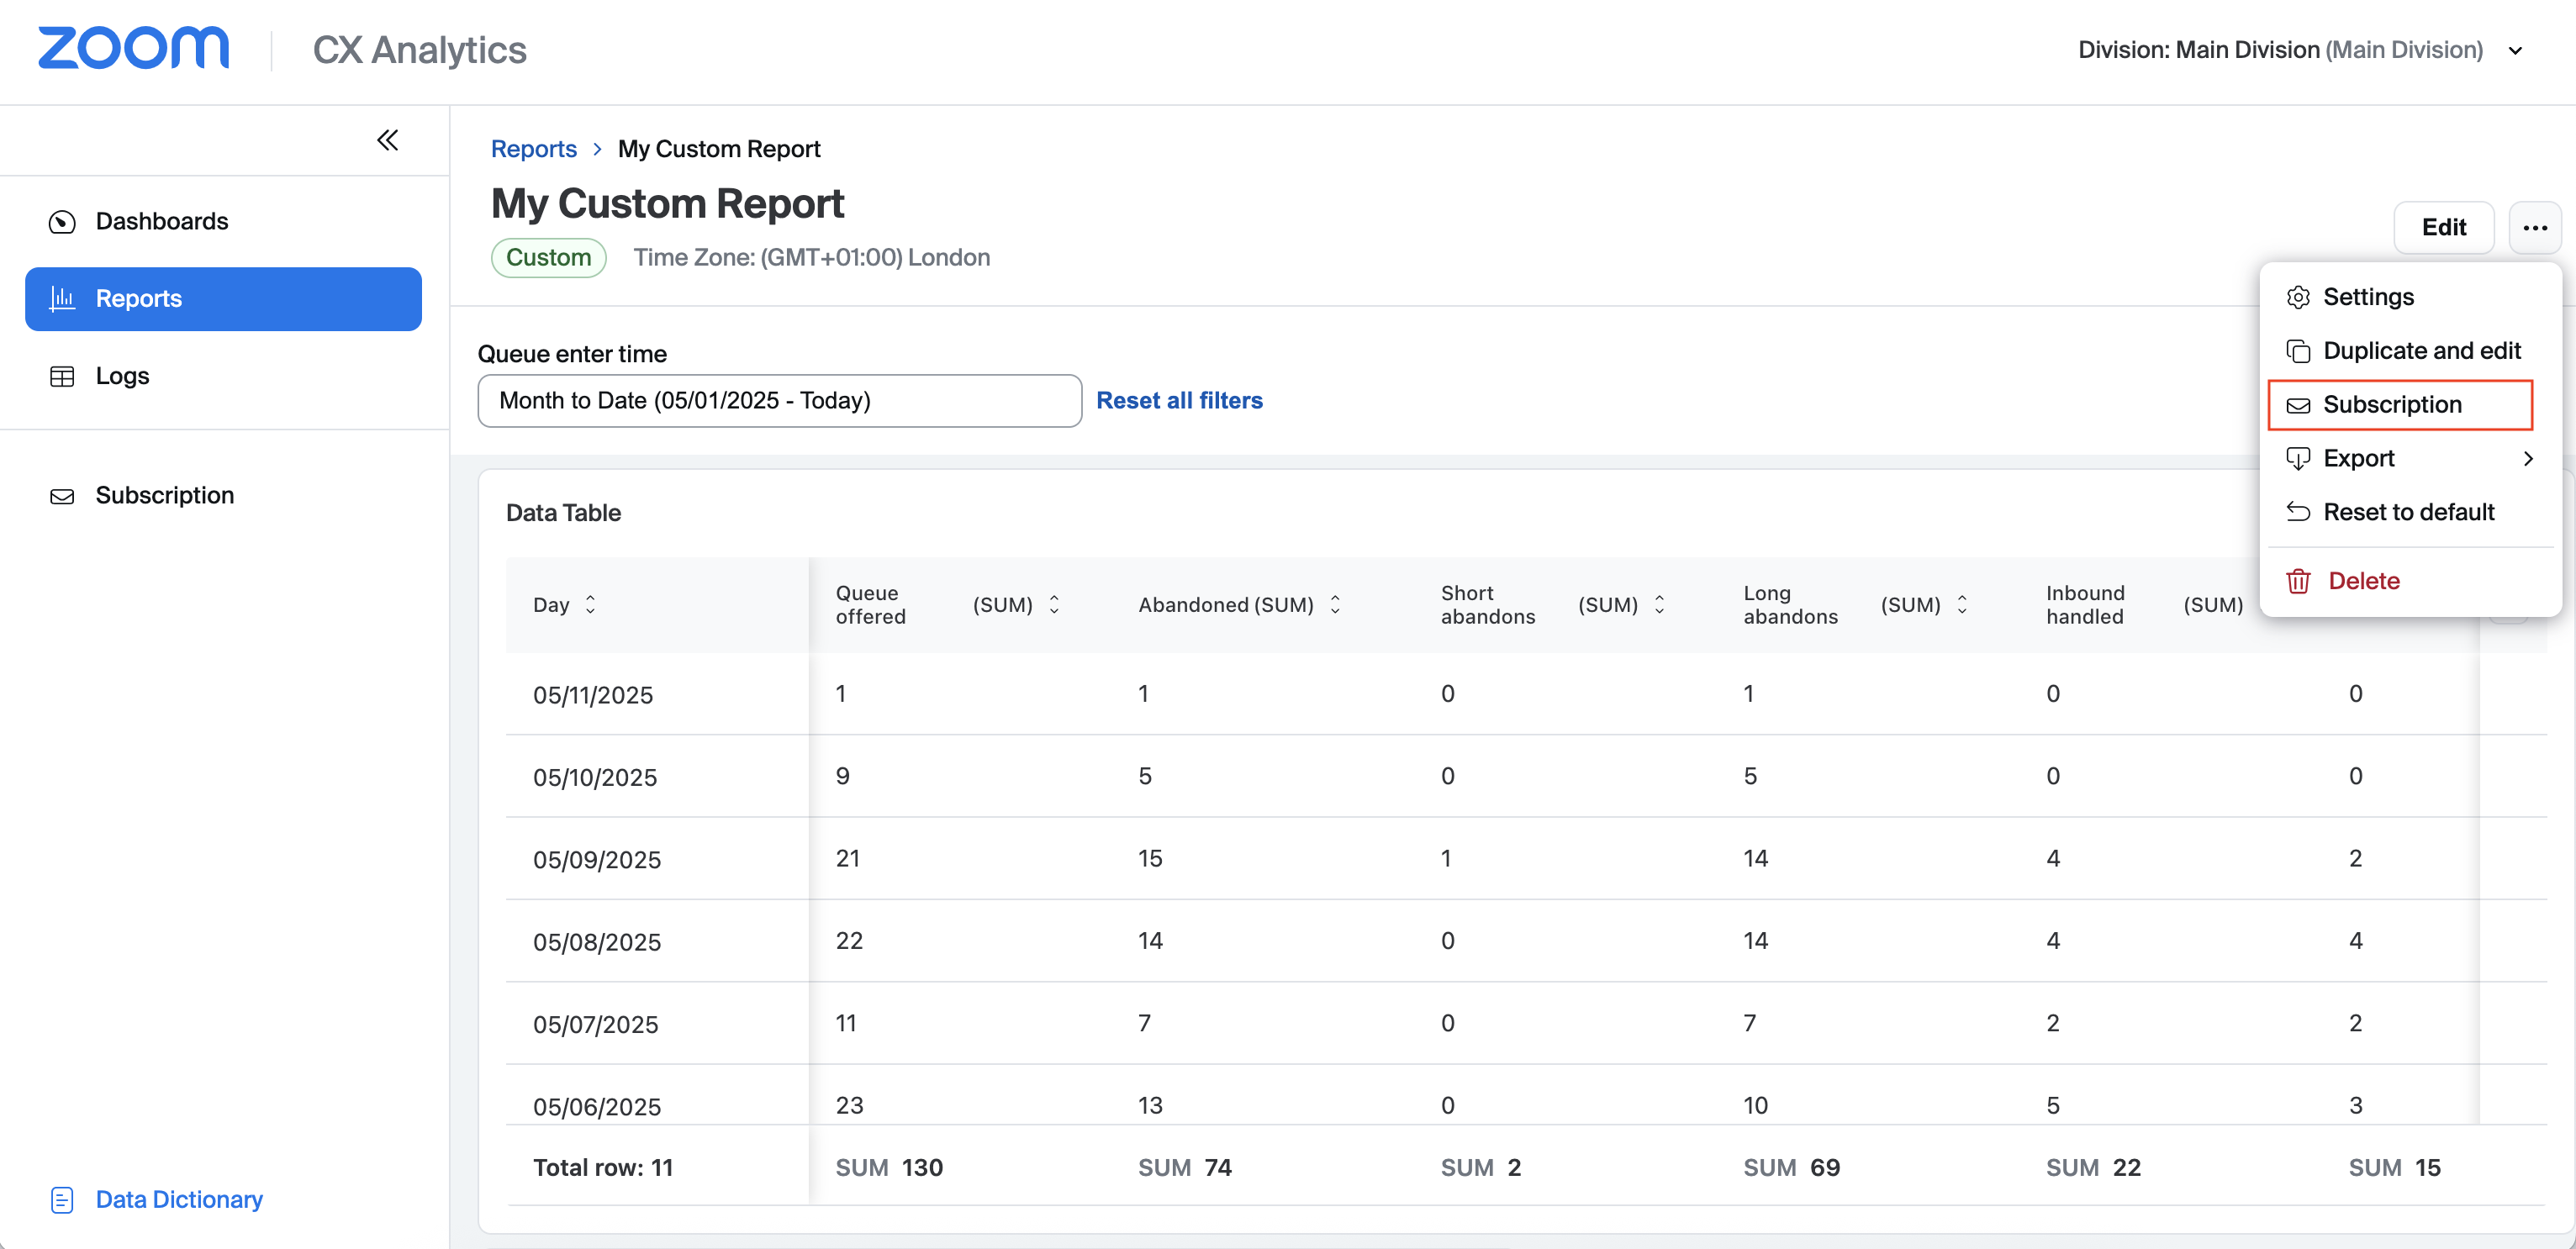
2. Open the report you'd like to subscribe to. You will find your reports in either the Default report or My reports section.
3. Click the ellipsis on the top right-hand side of the report, then select Subscription from the drop-down menu.
4. Complete the form by providing a subscription name, time zone, frequency and delivery format (CSV or XLSX).
5. In the Email recipients field, enter one or more email addresses separated by commas.
6. Check the box asking you to confirm that your email addresses are correct.
7. Click Add to complete the subscription.
Subscriptions can be managed by navigating to CX Analytics → Subscription. You can also delete, duplicate and pause subscriptions if needed.


