Easy-to-create flowcharts help visualize complex processes

Quickly create ready-to-share professional-looking flowcharts for work or school using Zoom Whiteboard, included with all Zoom Workplace plans.

Easy-to-create flowcharts help visualize complex processes
Primary use cases for flowcharts

Primary use cases for flowcharts

Flowcharts (or flow charts) are visual diagrams that represent the sequence of steps in a process or system. They help people understand, analyze, and communicate workflows or decision-making processes more clearly. Common uses include:

  • Process explanation

    Breaking down intricate processes into visual steps makes it easier to explain workflows, systems, or data flows to diverse audiences while promoting transparency.

  • Process documentation

    Enabling businesses to clearly define each step, highlight inefficiencies, and streamline operations.

  • Quality control processes

    Helping to identify errors or bottlenecks, thereby improving overall quality and performance.

  • Decision-making frameworks

    Diagramming step-by-step decision pathways, making it easier for teams to reach informed conclusions.

  • Structured visual aids

    Simplifying complex subject matter, helping educators foster better student comprehension and engagement.

Common types of flowcharts for business

Process flowcharts

Process flowcharts

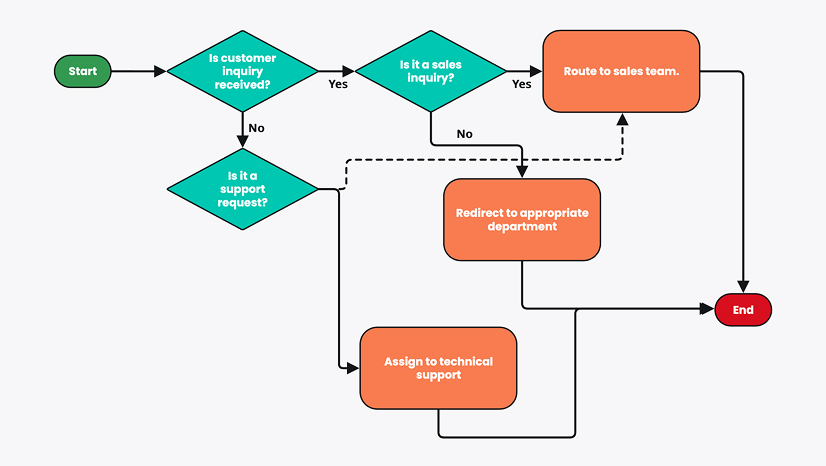
Provide a step-by-step visual representation of a business process or workflow from start to finish, pinpointing areas for improvement.

Data flowcharts

Data flowcharts

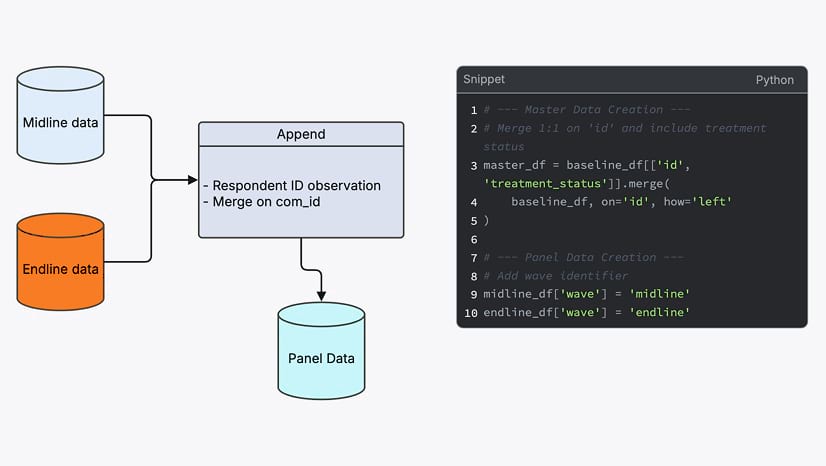
Serve as a tool for demonstrating how data moves through a system, aiding system developers and analysts in understanding the data life cycle.

Organizational flowcharts

Organizational flowcharts

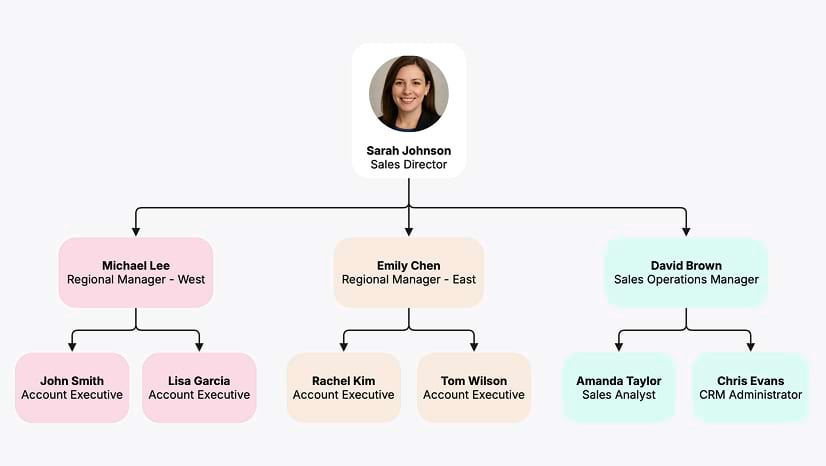
Lay out the hierarchy and relationship structure within a company, helping management and employees understand roles and reporting lines.

Decision flowcharts

Decision flowcharts

Offer a straightforward method for mapping out potential choices and outcomes to support strategic planning and decision-making tasks.

Swimlane flowcharts

Swimlane flowcharts

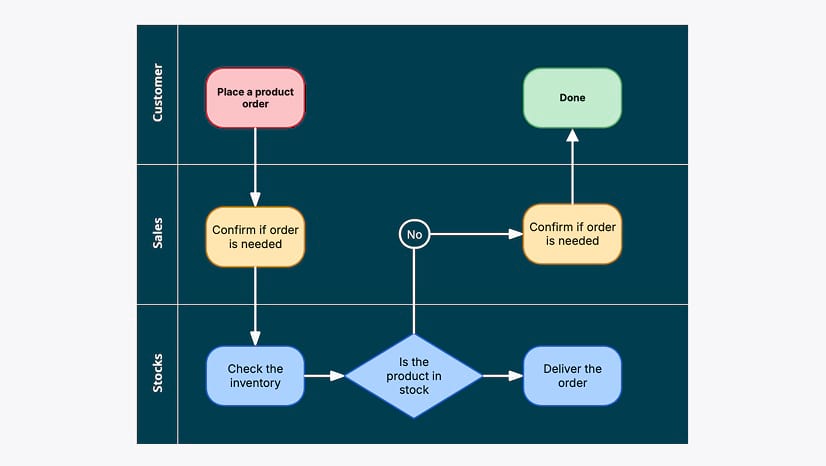
Divide tasks into lanes representing different departments or individuals to clarify roles and reduce redundancy by highlighting interdepartmental interactions.

Important features to look for in a flowchart maker

Library of flowchart templates

Library of flowchart templates

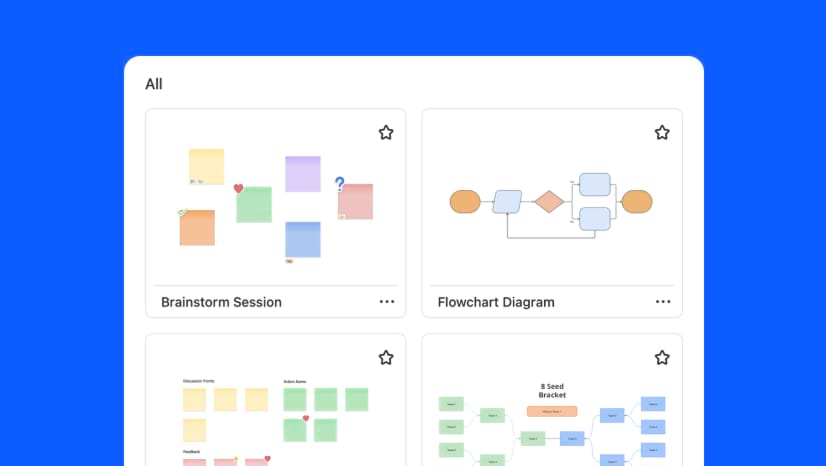
Access to pre-designed flowchart templates allows you to quickly start a diagram. A flowchart template provides ready-made elements that can be easily customized, saving time and ensuring consistency and clarity across different flowcharts.

Design-worthy elements and shapes

Design-worthy elements and shapes

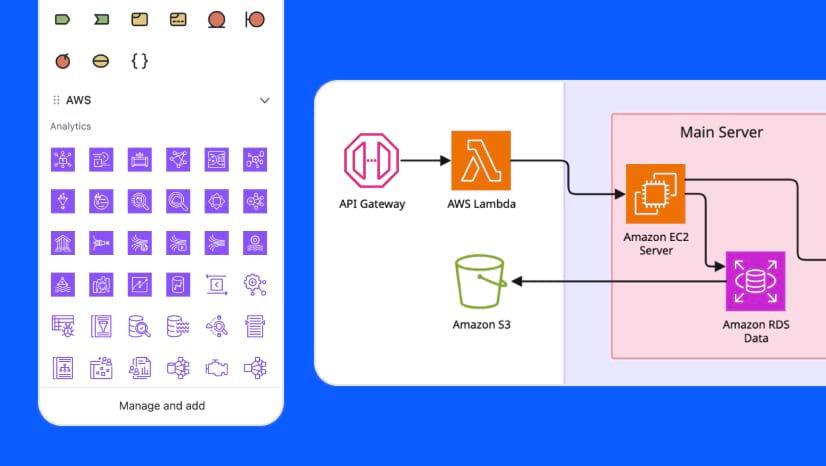
A wide selection of flowchart shapes and graphics, as well as tools for adjusting line thickness, shape sizes, and colors, allow you to create professional-looking, easy-to-understand flowcharts.

Intuitive drag-and-drop functionality

Intuitive drag-and-drop functionality

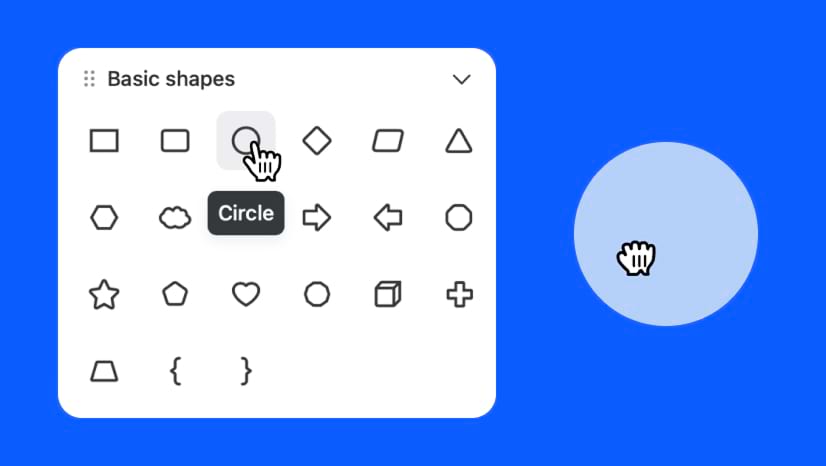
Easy-to-use drag-and-drop functionality makes it quick and simple to add, move, or modify flowchart symbols and elements without needing extensive technical knowledge.

Tools for tidiness

Tools for tidiness

Keep your flowcharts organized and easy to understand with smart automation tools that help align and straighten design elements like lines and shapes.

User-friendly canvas

User-friendly canvas

An “infinite canvas” ensures you never have to design a flowchart to fit in a rigid space or fixed document size. Plus, the ability to easily scroll, pan, or zoom into the canvas allows for more detailed views.

Collaborative capabilities

Collaborative capabilities

The ability to easily embed flowcharts into presentations, export them as images, and share them in webinars, video conferences, emails, chats, or in-person meetings boosts collaboration and idea-sharing.

How to quickly create flowcharts using Zoom AI Companion

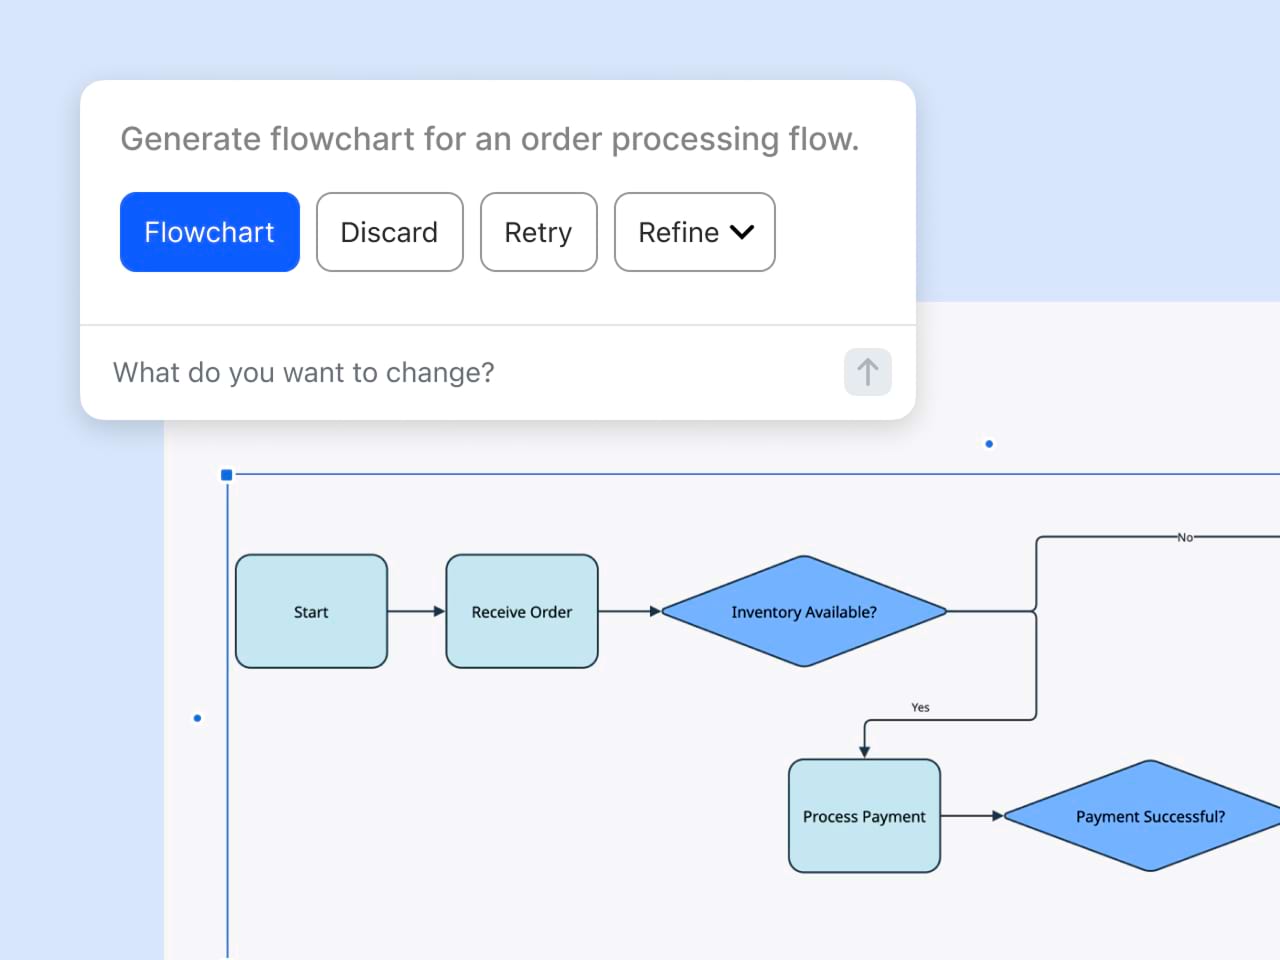
Save time and work using Zoom’s AI-first platform to create flowcharts in seconds using text prompts. With just a few clicks, Whiteboard Content Generation with AI Companion* lets you:

  • Generate ideas for flowchart processes

  • Refine and extend existing flowcharts

  • Format and add design elements with just a few clicks

  • Create multiple versions

  • Generate summaries

*Available with paid Zoom Workplace plans.

How to quickly create flowcharts using Zoom AI Companion

Get started with flowcharts in Zoom Workplace

  • Access to the tools you need

    Access to the tools you need

    Create visually stunning flowcharts with essential tools and access advanced diagramming features like creating reusable objects and uploading your own stencils. Start from scratch or choose a pre-designed flowchart template.

  • Collaborate on flowcharts together

    Collaborate on flowcharts together

    Zoom Whiteboard’s collaborative features allow multiple team members to work simultaneously on a flowchart, whether you’re meeting virtually or in a traditional meeting room.

  • Share flowcharts with others

    Share flowcharts with others

    The ability to easily share flowcharts in real-time on Zoom Whiteboard and across Zoom Workplace in chat messages, meetings, and docs enhances dynamic collaboration and makes them central to team meetings and training.

  • Access flowcharts at any time, on any device

    Access flowcharts at any time, on any device

    Create a flowchart in Zoom Whiteboard during a meeting — it’ll save automatically, then you can open and edit it on your Zoom Workplace desktop or mobile app, web portal, or Zoom Rooms for Touch device.

*Zoom Workplace Basic (free) includes up to three concurrently editable boards; AI Companion features are not included.

Guide: How to be a better flowchart maker

In this guide, we’ll cover the basics of flowchart components and design, how and why they’re used, and how to start creating flowcharts in Zoom Workplace.

Flowcharts (or flow charts) are powerful visual tools that transform complex information into easily digestible diagrams, enabling clearer communication and better teamwork. In today’s rapidly evolving work environments, becoming a better flowchart maker can significantly enhance your productivity and communication skills.


By diving into the essentials of flowchart creation and usage, we’ll uncover how these diagrams not only aid in organizing ideas but also in identifying inefficiencies to bolster overall organizational effectiveness. Whether you’re a novice or a seasoned professional, understanding the nuances of flowchart creation will empower you to use them effectively in your daily work, fostering a more collaborative and informed environment. Let’s dive in.

Flowcharts are visual diagrams that provide a straightforward method for professionals to visualize and organize complex processes. They make it easier to communicate information that can be difficult to describe or visualize with other types of diagrams such as tables and graphs.


For someone looking to make and use flowcharts professionally, these diagrams can significantly improve project management by mapping out timelines, designating responsibilities, and outlining workflows. This not only enhances team alignment but also enables the identification and resolution of bottlenecks before they impede progress. 


In environments with complex decision-making processes, such as engineering, manufacturing, or business management, flowcharts help delineate clear pathways and outcomes, facilitating quicker and more informed decisions. As a professional, mastering the creation and use of flowcharts can transform your ability to streamline operations, enhance communication, and ultimately drive better organizational results.

Before you start making flowcharts, you’ll want to familiarize yourself with common flowchart types and understand which industries and fields they might be used. Armed with this information, you can consider your own use case and purpose for using flowcharts, and what type of information or process you need to visualize.


Process flowcharts or process maps: Provide a detailed visual depiction of a process or workflow, with arrows guiding the sequence of tasks. Process flowcharts are used in industries such as manufacturing and logistics to streamline operations, identify inefficiencies, and ensure quality control through precise mapping of each stage in the production cycle.


Data flow diagrams (DFD) or data flowcharts: Visually represent how data moves through a system, serving as an important tool for developers and system analysts in designing efficient programs and databases in fields like software development and information technology.


Workflow diagrams or flow diagrams: Used across sectors like healthcare and business management, these flowcharts detail tasks, responsibilities, and processes to help outline a specific workflow and improve team coordination.


System flowcharts: Commonly used by IT professionals or in computer programming, these flowcharts map out the detailed logic of systems when a thorough representation of system functionalities, code journeys, and data pathways is needed.


Swimlane diagrams or swimlane flowcharts: Also called cross-functional flowcharts, these are particularly useful for complex projects that require clarity around departmental responsibilities. They’re commonly used in sectors such as finance and healthcare, where interdepartmental coordination is key.


Program flowcharts: Show logical sequences and are often employed in software engineering for illustrating algorithms and coding processes.
Decision flowcharts: Clearly represent decision points and possible outcomes, assisting business strategists in envisioning potential impacts before implementing key decisions.

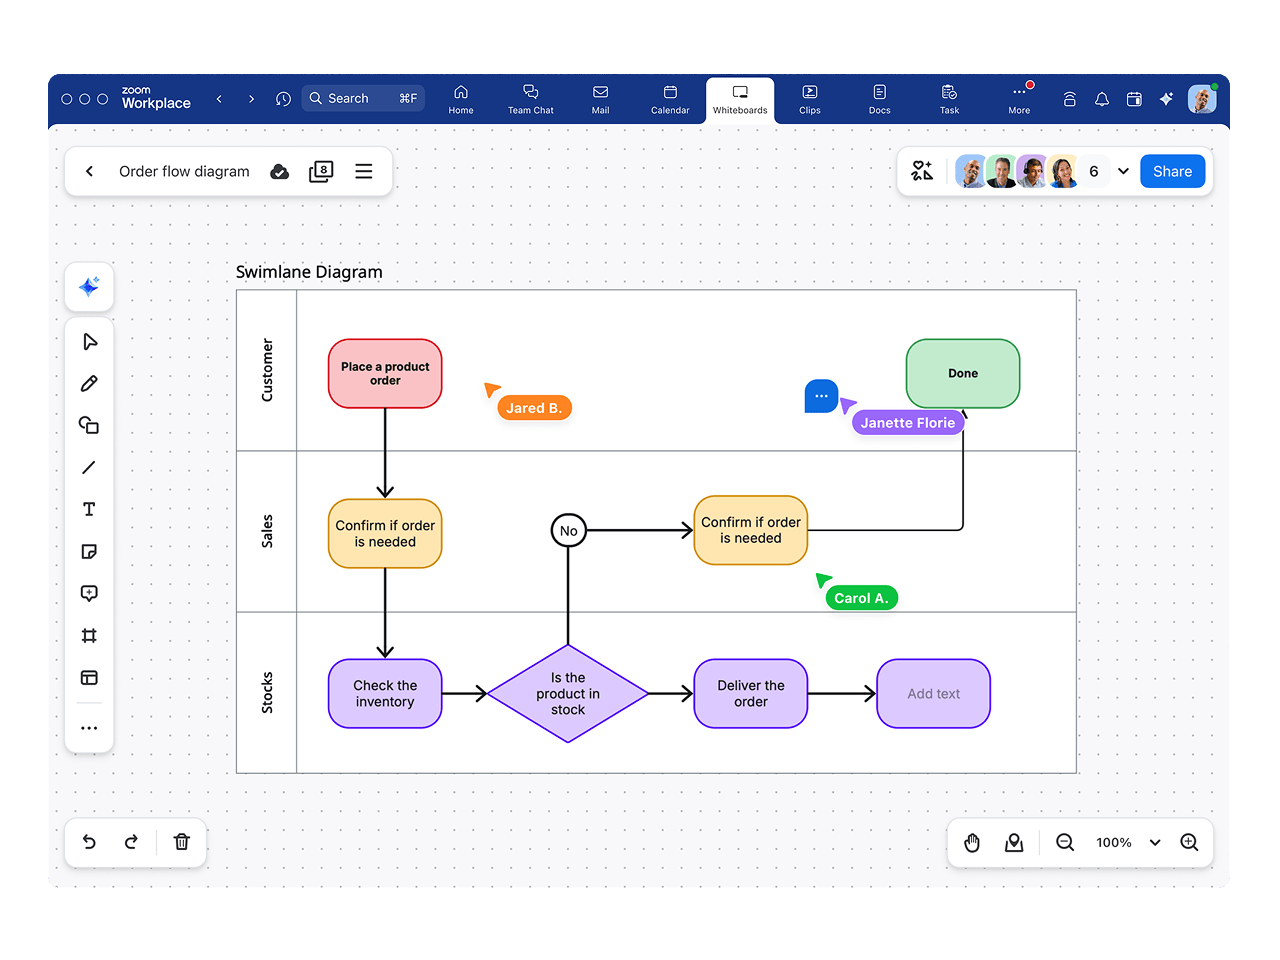
When creating flowcharts, you’ll use specific symbols to represent different tasks, actions, decisions, or outcomes in a process. Each symbol has a designated role that allows you to visually show how steps are connected, where decisions are made, and how data or tasks flow from one point to another. By using standardized symbols, anyone viewing your flowchart can easily interpret it, no matter how simple or complex the process is.


Below is a list of the most common flowchart symbols you’ll use in your process mapping.


  • Oval (terminal or terminator symbol): Used to represent the start or end of a process.
  • Rectangle (process symbol): Represents a process, action, or operation in the flowchart.
  • Diamond (decision symbol): Indicates a decision point, typically requiring a “yes” or “no” answer.
  • Parallelogram (input/output symbol): Used to represent input or output operations, such as entering data or displaying results.
  • Arrow or arrowhead (flowline symbol): Shows the direction or flow of the process.
  • Circle (connector symbol): Used to connect different parts of the flowchart, often when the flowchart is split across multiple pages or sections.
  • Document or documents symbol: Represents a document or report generated during the process.
  • Predefined process symbol: Indicates a process or subroutine that has been defined elsewhere, often used for modular processes.
  1. Identify your purpose and process: Determine the process or workflow you want to map and which type of flowchart to use (refer to this list of common flowchart types). Break the process down into key steps, actions, or decisions that need to be represented in the flowchart.
  2. Choose flowchart symbols: Select the appropriate flowchart symbols for each step. Use standardized symbols, as outlined above, including ovals for start/end, rectangles for actions, diamonds for decisions, and arrows to show flow direction.
  3. Map the process: Begin your flowchart with the “Start” symbol, then arrange the other symbols in sequence, connecting them with arrows to show the flow of the process. Be sure to allow enough space between symbols so it’s not too crowded, and make sure each step follows logically from the previous one.
  4. Add decision points: If your process includes decisions, use diamonds to represent them. Ensure each decision has at least two possible outcomes (for example, “Yes” or “No”) and connect them accordingly. If relevant, you can also identify who is responsible for the decision.
  5. Review and refine: Once your flowchart is complete, review it for clarity and accuracy. Make sure all steps are included and that the flow is easy to follow. 


It may be helpful to share it with a team member for feedback to help you refine the layout and improve readability.


When your flowchart is ready to share, simply click the “Share” button at the top right corner of the whiteboard. From here, you can grant access to anyone in your organization or share it externally with a shareable link (if enabled). Once you set the permissions, click “Copy Link” and paste the URL in the chat message, Zoom Team chat channel, or email.

Flowchart templates are a great way to quickly get started with creating flowcharts, especially when you’re new to process mapping or need to create one under time pressure. For any flowchart maker, novice or experienced, using a template eliminates the need to design a flowchart from scratch, allowing you to focus on customizing the template to fit your specific needs.


With a pre-designed template, you can easily adapt the flowchart by moving the symbols to adjust the flow and inserting additional symbols to suit the process you’re mapping. Flowchart templates are particularly helpful for recurring workflows, team projects, or standard processes, ensuring consistency across documents and saving time.


In the Zoom Workplace app, flowchart templates are readily available in the Whiteboard tab, making it even easier to get started. Simply open a whiteboard and select from a variety of professionally designed template options. With Zoom’s user-friendly interface, you can quickly modify the template to match your requirements, add or remove steps, and collaborate with others in real time. Whether you’re working alone or with a team, this feature allows you to create flowcharts faster and more efficiently.

Now that you know how and why flowcharts are used, what the different types are, and how to use flowchart symbols and templates, you’re ready to create your own flowcharts. 


The good news is that if you have a Zoom Workplace plan — even the free Basic plan — you have access to Zoom Whiteboard and can create a flowchart from scratch or with a template.* If you don’t have a Zoom Workplace account, you can sign up and quickly get started.


You can create a flowchart on a whiteboard from a Zoom meeting or webinar, or the Zoom web portal, desktop, or mobile app.


Follow these three steps to start making a flowchart in the Zoom Workplace desktop app:


  1. From the app menu, click the Whiteboard button. At the top right, click “New” to create a new whiteboard.
  2. A new whiteboard will open and you’ll have the option to select a flowchart template from the template dashboard. To create a flowchart using a template, select a category in the left menu and search for the type of flowchart you want to create. You can click “Preview” to see the flowchart example. When you find a template you want to use, click “Use template” at the top right. If you prefer to start a flowchart from scratch, close the template dashboard.
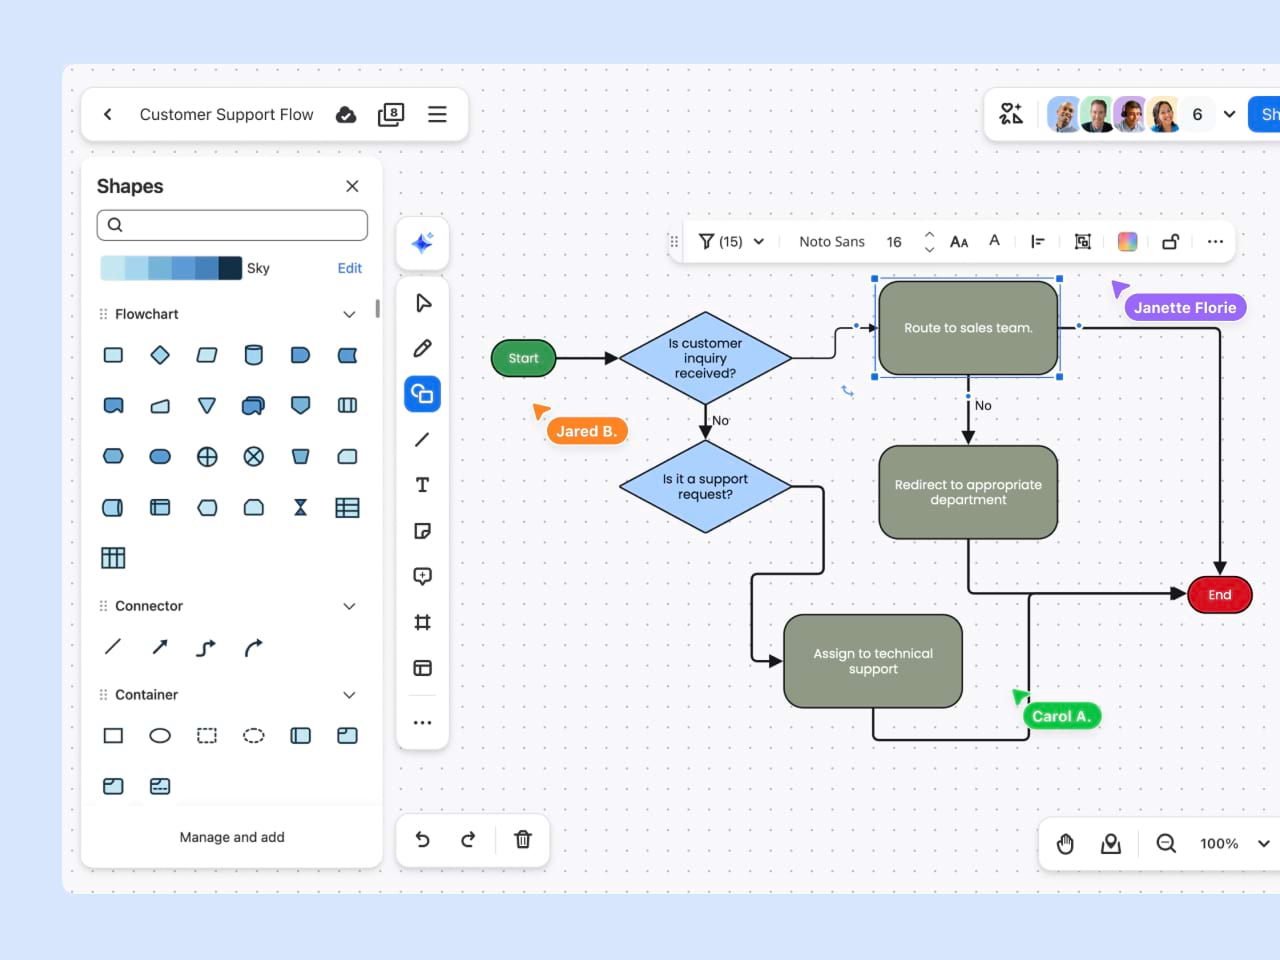
  3. The new whiteboard will open with your selected template or as a blank whiteboard. From here, you’ll use the whiteboard editing tools available in the menu on the left. Use the drag-and-drop functionality to adjust flowchart symbols on the template and edit the text and data. Or, if you’re starting from scratch, use the different tools to select from 1,000 symbols and shapes, lines, text, and more to design your perfect flowchart.


*Zoom Workplace Basic (free) includes up to three concurrently editable boards; AI Companion features are not included.

Whether you need to create and use a flowchart for school or work, improving your flowchart-making skills will prepare you to create different flowchart types for any use case. By integrating flowcharts into projects and workflows, you’ll improve communication, enhance collaboration, and foster a culture of continuous learning, ultimately leading to more efficient and successful outcomes.


Ready to create flowcharts? All Zoom Workplace plans include Zoom Whiteboard. Get started today — sign up for a Zoom Workplace plan, or sign in to your existing account.